Market Recap for January 7, 2016
Once again the best performing sectors were the three defensive groups - utilities (XLU), consumer staples (XLP) and healthcare (XLV). All of our aggressive sectors tumbled anywhere from 2%-3% with technology leading the way. A number of industry groups within technology are either breaking down or on the verge of it. As an example, check out the Dow Jones U.S. Electronic Equipment Index ($DJUSAI):
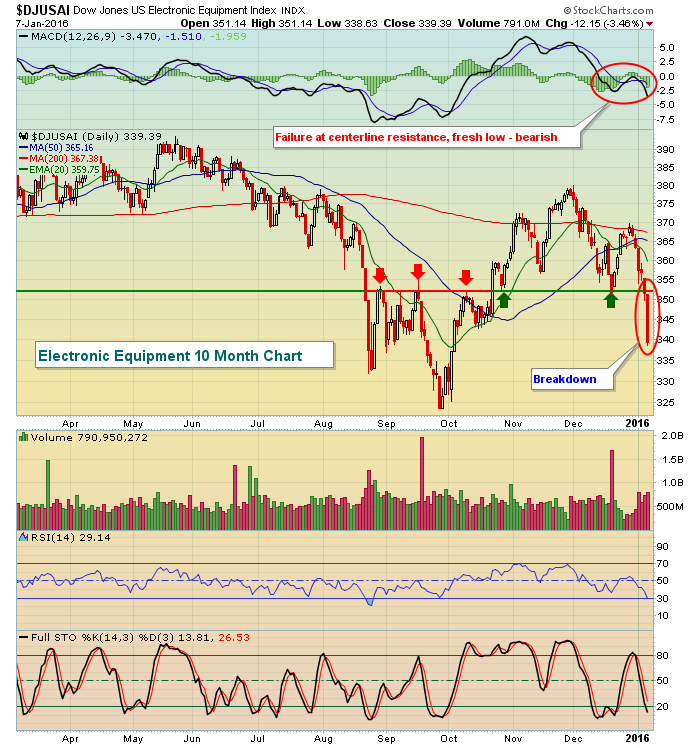
There has seemed to be an important line at 352 over the past several months and the DJUSAI violated it in a big way on Thursday. Volume was quite heavy and price momentum (MACD) suggests there's more weakness to come. Unfortunately, more and more industry groups are looking like this. It doesn't mean we can't bounce, but a bounce is about all I'd look for. The only time I could consider growing much more bullish would be an S&P 500 test at or near August lows, especially if accompanied by a big volume, reversing candlestick.
A key component of the financial sector - asset managers ($DJUSAG) - experienced a very significant breakdown on Thursday that needs to be reversed quickly or we can expect more selling this space as well. The following chart is really a classic in terms of technical analysis. Take a look:
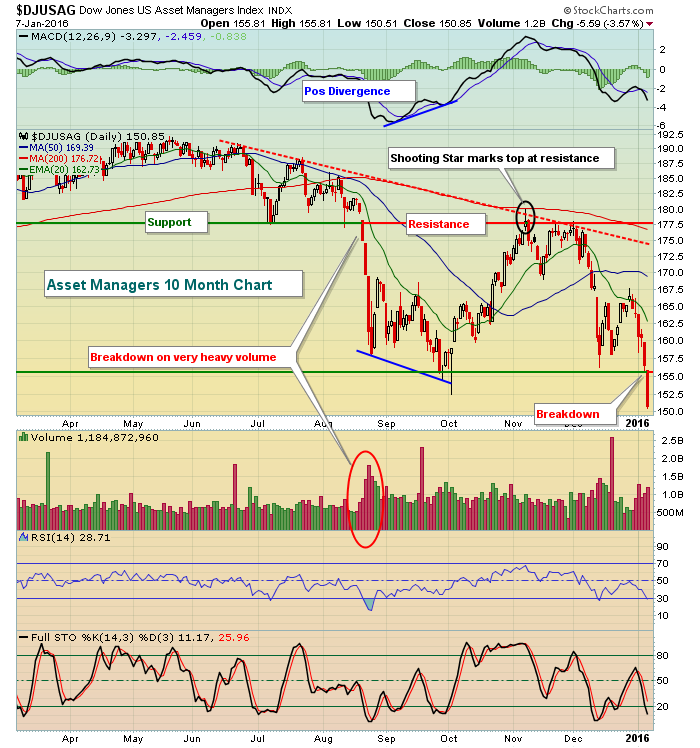
I literally could talk about this chart for an hour. First, look at the August price breakdown and the heavy volume that accompanied it. That tells us the prior support becomes resistance - should we get there. Before we saw a recovery, however, the DJUSAG continued selling until a positive divergence printed. That foretold a reversal back to the upside as selling momentum slowed. Note the hammer that printed at that final low in early October. Reversing candlesticks with positive (or negative) divergences can be a very powerful combination for traders. The ensuing rally then carried the DJUSAG back to the price resistance mentioned earlier. At the very end of the rally, a classic shooting star printed and the action once again reversed. That "tail" (intraday high) appeared as if a breakout was going to occur. Then the market makers pulled the proverbial carpet out from under the bulls. After a couple more tests of price and trendline resistance (red dotted line), the downtrend resumed. In mid-December, price support established from the September/October low was tested and we saw one final bounce back to the declining 20 day EMA before Thursday's breakdown. Classic technical action and now a very bearish chart. The fact that it's a key component within the financial sector is not good. A quick recovery and close back above 156 is important if you're bullish.
Pre-Market Action
Well, when you see a VIX in the mid-20s, you can expect serious volatility. We've seen the huge gap downs to start 2016, now the action is flipping this morning. Perhaps it's just temporary relief, but European indices are higher on the heels of the China Shanghai Composite ($SSEC) gaining 2% overnight. Then throw in much better than expected December jobs numbers (and upwardly revised jobs numbers for November as well) and all of a sudden, traders seem to be in a much better mood to start this Friday. U.S. futures are up better than 1% so now the question becomes, "Will the gains hold?" Failure to hold and new lows would be a very bearish sign so let's see how we close out the week.
Current Outlook
The shift from transportation stocks ($TRAN) to utility stocks ($UTIL) has been at an alarming rate the past 5-6 weeks. This doesn't bode well for our major indices as market participants are clearly disagreeing with the Federal Reserve as to the prospects of the U.S. economy in 2016. That can change, but we need to see it on the charts. We can't simply sit back and hope it changes. It's not the end of the world, but it could be the beginning of a bear market. Conditions over the past several months have deteriorated to the point where I'm considering this to be more than a correction. However, I need a long-term price breakdown on the S&P 500 to confirm the deteriorating conditions under the surface. That would occur if the S&P 500 were to lose support in the 1825-1850 area. In the meantime, this recent selling could be nothing more than further sideways consolidation in a continuing 7 year bull market. The following charts show the deterioration in the $TRAN:$UTIL ratio and then the key trading range on the S&P 500:
Transports vs. Utilities ($TRAN:$UTIL):
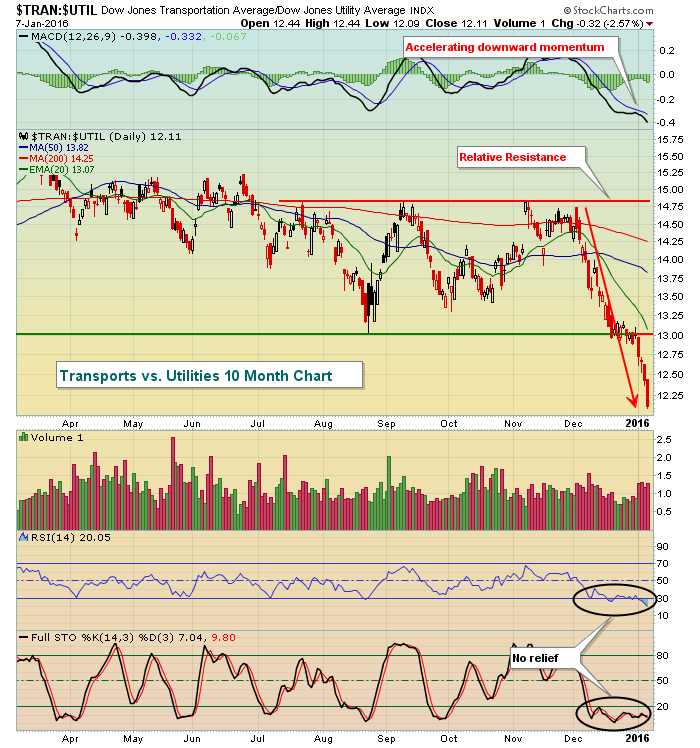
Make no mistake, the shift to defense here has been fast and furious.
S&P 500:
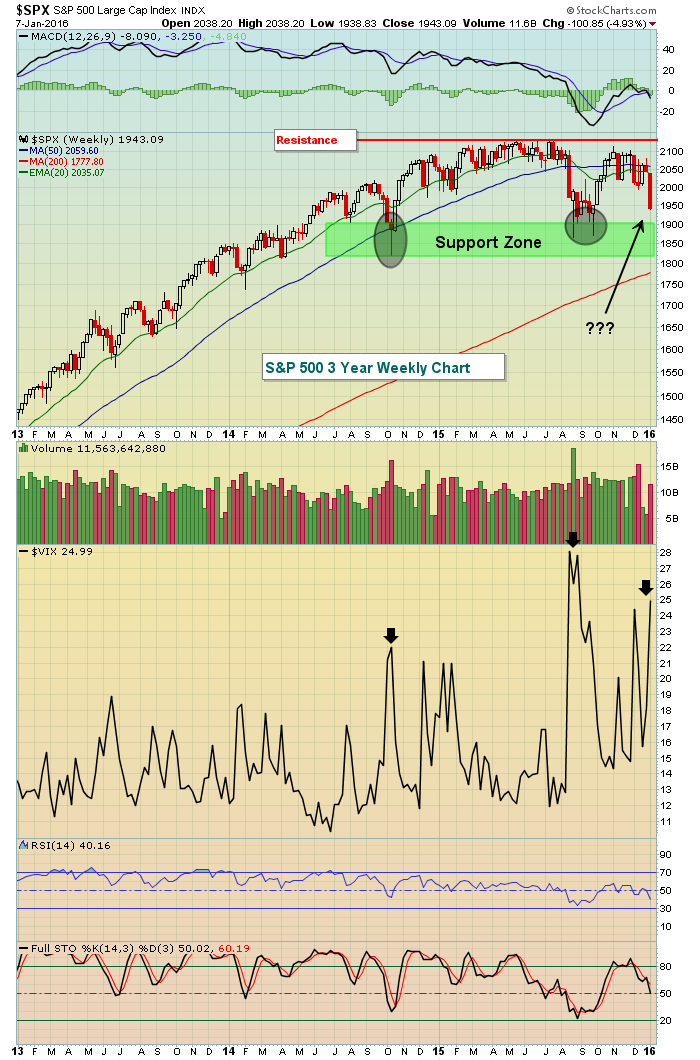
Those two key lows (black shaded areas) were both set with high VIX readings. In other words, market participants were in a panicked state when those lows were established. They generally mark significant support. Because the S&P 500 has enjoyed a long seven year bull market, losing key price support over multiple years would increase the odds that we're moving into a bear market and extended period of declining prices. Nothing.....I repeat NOTHING...is more important to me than the combination of price/volume. So while other beneath the surface signals are suggesting we're already in a protracted downtrend, I'm not buying into that theory until price/volume confirms.
Sector/Industry Watch
Let's consider two key bullish industry charts that BOTH tested key price support on Thursday. The last thing the bulls want to see right now if support fail on two leaders. Check out these two charts as the price support seems obvious to me:
Dow Jones U.S. Toys Index ($DJUSTY):
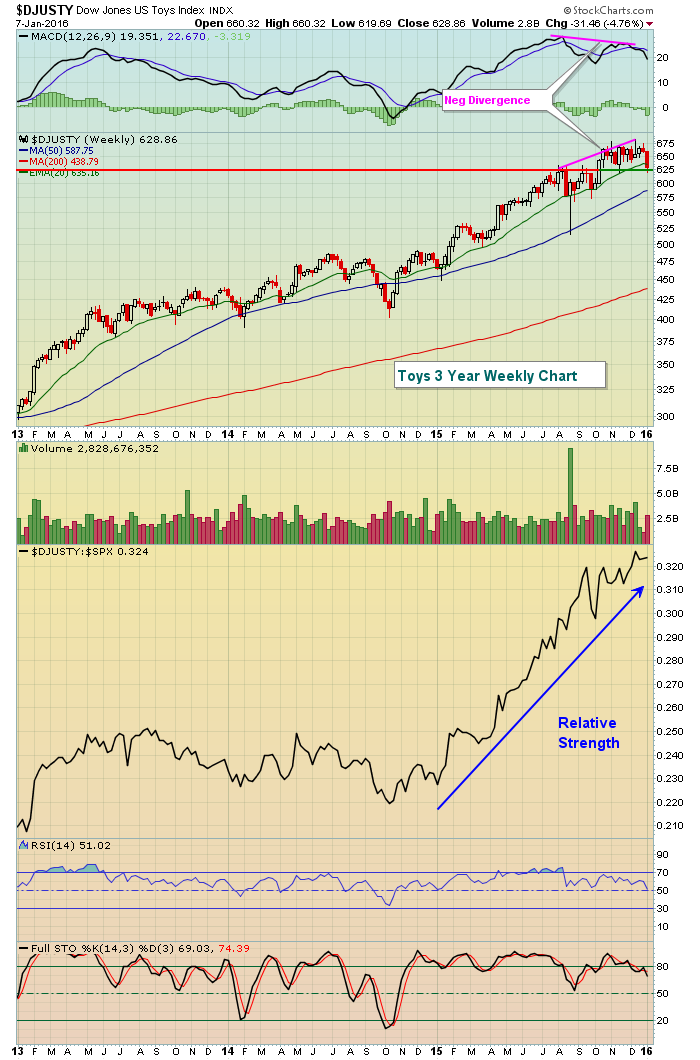
The strength in toys over the past year has been obvious, but this group is testing price support with an ugly weekly divergence. Volume on the breakout that created the negative divergence, though, has been quite strong. So we've got mixed signals. Still, given the overall state of the U.S. stock market in 2016, I'd be very careful if this group breaks below price support OR if the group returns to recent highs on diminishing volume.
Dow Jones U.S. Internet Index ($DJUSNS):
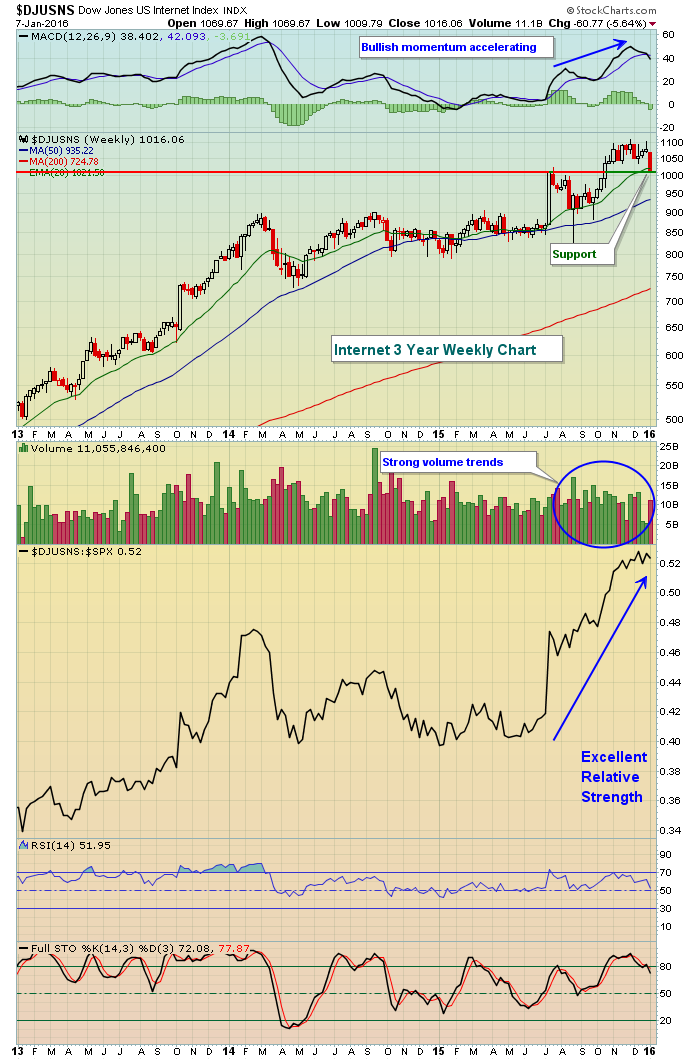
I'd argue that internet stocks are the best place to be on the long side. Strong relative strength. Accelerating momentum to the upside based on higher MACD readings on fresh price highs. And now that we've seen a pullback, look for the rising 20 week EMA and price support near 1015 to hold. If internet stocks fail, I'm not sure how the tech-heavy NASDAQ avoids further selling.
Historical Tendencies
Since 1950 on the S&P 500, Wednesdays and Fridays have produced much stronger results than the other days of the week. The NASDAQ has shown concentrated strength Wednesdays through Fridays since 1971. Monday, without question, has been the weakest calendar day of the week on all of our major indices. For instance, over the past 65 years, Monday's have produced NEGATIVE annualized returns in excess of 15% on Mondays. That's a full 24 percentage points beneath the average annual return on the S&P 500 of roughly 9% over the same period. Fairly astounding, huh?
Key Earnings Reports
None
Key Economic Reports
December nonfarm payrolls released at 8:30am EST: 292,000 (actual) vs. 200,000 (estimate)
December private payrolls released at 8:30am EST: 275,000 (actual) vs. 193,000 (estimate)
December unemployment rate released at 8:30am EST: 5.0% (actual) vs. 5.0% (estimate)
December average hourly earnings released at 8:30am EST: 0.0% (actual) vs. 0.2% (estimate)
December average workweek released at 8:30am EST: 34.5 hrs (actual) vs. 34.5 hrs (estimate)
November wholesale trade to be released at 10:00am EST: +0.0% (estimate)
Happy trading!
Tom


