Note: Two quick reminders. First, if you haven't already, please subscribe to my blog. By doing so, my blog articles will be sent directly to your email upon publishing. You'll receive my article the moment it's published. It's easy and it's free. Simply go to the bottom of this article and you'll see a question asking if you'd like to receive email notifications. Click the "yes" button, type in your email address and click "Subscribe". Voila! Next, please join me for my webinar later today. It starts at noon EST, is FREE and lasts approximately one hour. I delve into various technical aspects of the market, not only what's driving it today, but also there's a long-term flavor. There's been a major shift in sector rotation the past few months, apparently bracing for the third bear market of this century. I enjoy teaching what I've learned over the years so hopefully there's an educational slant to it as well. To register, simply CLICK HERE. Hope to see you there!
Market Recap for January 14, 2016
Yesterday, the stock market took a deep breath, relaxed and all of our major indices moved HIGHER in unison for the second time in the last three sessions. Whew! Well, don't get too comfortable as U.S. futures are tumbling this morning. More on that in the Pre-Market Action section below. Thursday was a PERFECT example of how we can apply the "Don't judge a book by its cover" adage to the stock market. On the surface (cover), all of our major indices were higher and sailing along. Despite selling in the final hour, our major indices were up anywhere from 1.5%-2.0%, rebounding nicely from Wednesday's mass exodus. All nine sectors were higher, led by energy's (XLE) huge 4.3% advance. That was actually part of the problem, though. Energy was deeply oversold after a 20% drop in just the last ten weeks. Ever heard of a "dead cat bounce"? That seemed to define energy's climb. Beyond energy, the Dow Jones U.S. Biotechnology Index ($DJUSBT) rose more than 4% after getting pummeled on Wednesday. The DJUSBT had closed below 1650 on Wednesday so it was a defining moment technically for the group yesterday and the bulls responded - at least temporarily. Check out the following chart:
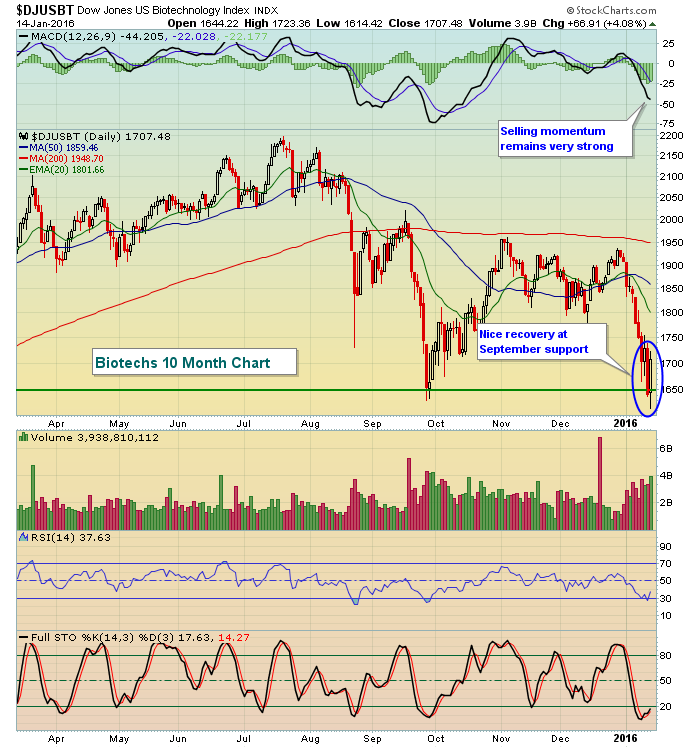
Wednesday's close on the DJUSBT had cleared prior closing support, but intraday support had not been lost and was one last hope for the bulls. After a poor start on Thursday, buying resumed and this group rose 4% to help healthcare (XLV) post the second best return on the session among sectors. So that's energy and healthcare leading our advance. Technology (XLK) was fairly strong, gaining nearly 2% and led by software ($DJUSSW) and internet ($DJUSNS). But then the next two sectors were materials (XLB) and utilities (XLU). Which sectors were bringing up the rear on this "wonderful" day? Consumer stocks (XLP and XLY), financials (XLF) and industrials (XLI). Does it sound to you like traders were in "risk on" mode? Don't think so. Hhhhmmmmm.
Pre-Market Action
Crude oil ($WTIC) is, in the words of the late great David Bowie, "under pressure" and so is China's Shanghai Composite ($SSEC). Oil fell below $30 per barrel today after a weak bounce on Thursday. The SSEC is at major price support just below 3000. Last night's 3.5% drop is not reflected on the following chart, but the level of support is clear:
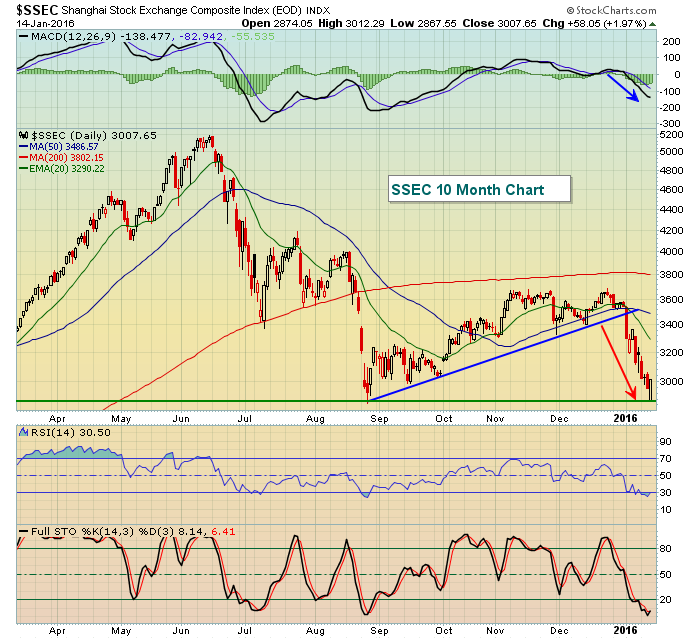
The correlation between the SSEC and the S&P 500 is not nearly as strong as most other global equity indices with the S&P 50, but the headline losses in China are having an impact here due to the extremely high volatility readings (VIX). When traders are nervous, any bad news means SELL. The combination of slumping oil prices, falling equity prices in China and last night's unimpressive earnings report from technology stalwart Intel (INTC) have traders on edge once again as we open another trading session.
U.S. futures look to lose most, if not all, of Thursday's gains at the opening bell.
Current Outlook
Getting back to that "Don't judge a book by its cover" theme, I want you to take a look at one simple chart. I know I rant a lot about how money is rotating between sectors and how certain intermarket relationships are evolving, but a picture was painted yesterday throughout the session. The title of the painting was RISK OFF. Those intraday gains looked and felt nice after a brutal start to 2016. But WHAT were traders buying? How much conviction did they have? How much risk were they willing to take? Bull markets consist of risk taking. Bull markets are not sustained by buying companies that sell soap. Don't get me wrong, I'm a huge fan of showering and smelling fresh. But personal hygiene doesn't equal market hygiene.
I've been waiting to see where traders would place their bets on the first significant rally after the past two weeks of selling. To put it rather bluntly, I was not impressed at all. The following intraday chart shows the S&P 500 rising nicely (the cover of the book). But how did the various key intermarket relationships fare simultaneously? Here's your answer visually:
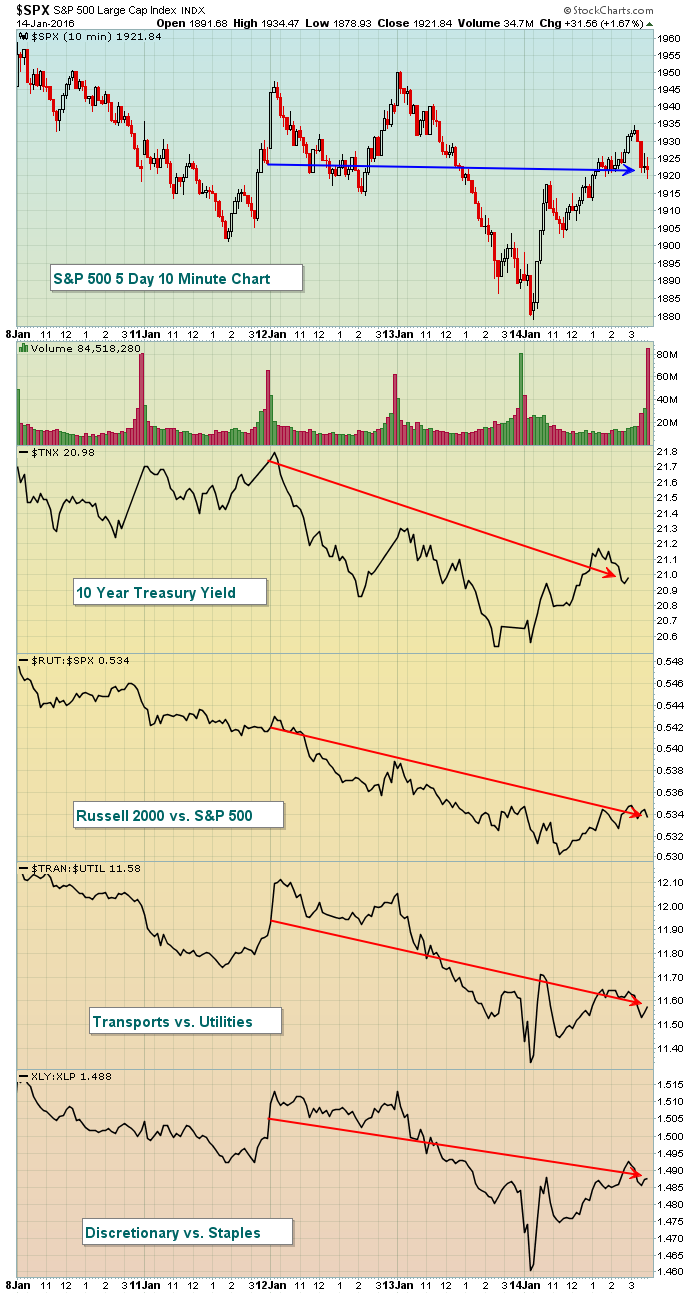
During our recent "recovery", equities have advanced two of three sessions although the net has been breakeven as evidenced by the flat blue arrow on the S&P 500 chart above. Look at the continuing deterioration in my various risk on indicators. If traders are in risk on mode, all of these readings or relative readings should be moving higher. None of them did. And the action Thursday alone really wasn't that impressive. Both the RUT:SPX and TRAN:UTIL fell yesterday. The XLY:XLP barely budged higher. While the TNX did move up, it remains in an obvious downtrend. I will emphasize once again that none of this guarantees us anything. But if I'm being honest and looking to evaluate the health of recent market action to evaluate risk, I'd put this market on a ventilator. I'll remain on the sidelines for now.
Sector/Industry Watch
I mentioned that internet stocks ($DJUSNS) enjoyed a nice day on Thursday. To be honest, its gains didn't quite make it back to price resistance lost on Wednesday. Check out the recovery:
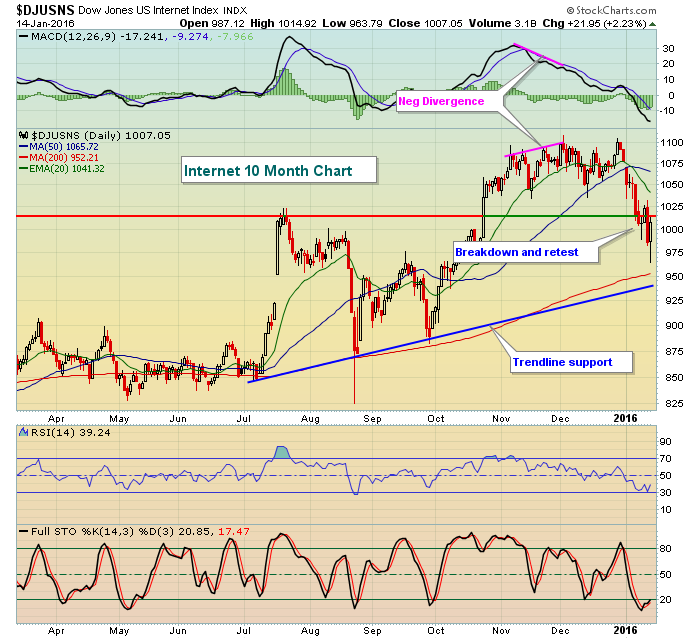
Given the breakdown, retest and reeling futures this morning, it would appear that the rising 200 day SMA and trendline support would be the next two support levels to be visited.
Historical Tendencies
The poor January results thus far do not bode well for market performance the balance of 2016. There is a very strong correlation between January performance and February through December performance. As we get closer to final January results, I'll provide more details regarding this positive correlation. For now, just recognize that this January behavior is not a historical positive for equities in 2016.
Key Earnings Reports
(actual vs. estimate):
C: 1.06 vs 1.04
FAST: .39 vs .40
PNC: 1.87 vs 1.80
RF: .21 vs .19
USB: .79 vs .79
WFC: 1.03 vs 1.02
Key Economic Reports
December PPI released at 8:30am EST: -0.1% (actual) vs. -0.2% (estimate)
December Core PPI released at 8:30am EST: +0.1% (actual) vs. +0.1% (estimate)
December retail sales released at 8:30am EST: -0.1% (actual) vs. +0.0% (estimate)
December retail sales excluding autos released at 8:30am EST: -0.1% (actual) vs. +0.2% (estimate)
January empire manufacturing survey released at 8:30am EST: -19.37 (actual) vs. -4.00 (estimate)
December industrial production to be released at 9:15am EST: -0.2% (estimate)
December capacity utilization to be released at 9:15am EST: 76.9% (estimate)
November business inventories to be released at 10:00am EST: +0.0% (estimate)
January consumer sentiment to be released at 10:00am EST: 93.0 (estimate)
Happy trading!
Tom


