Market Recap for Wednesday, January 13, 2016
What a mess. Money has been rotating toward defense for months and now we know why. Because market participants want nothing to do with risk right now. Last year, the sectors attracting sellers were energy (XLV) and materials (XLB). Those two groups held back gains on the S&P 500. This year, many other sectors have joined them. Energy and materials have remained the weakest two sectors over the past month, but all of the aggressive sectors - technology (XLK), financials (XLF), industrials (XLI) and consumer discretionary (XLY) - are all down more than 5% just in the past 30 days. Consumer discretionary lost more than 3% yesterday alone! Poor rotation, high volatility and technical breakdowns spell trouble. How much trouble? Well, that's not an easy question to answer. The first question to be answered will be whether our major indices hold onto the price support established in October 2014 and August 2015. For a look at the possibilities on the Russell 2000 ($RUT), check out the Current Outlook section below.
All nine sectors fell on Wednesday, although utilities (XLU) lost just 0.05%, responding positively to a further drop in the 10 year treasury yield ($TNX). All other sectors were bashed, including healthcare (XLV), as biotechnology stocks ($DJUSBT) fell more than 5% on the session and lost its September 2015 low. Check out the stumbling group:
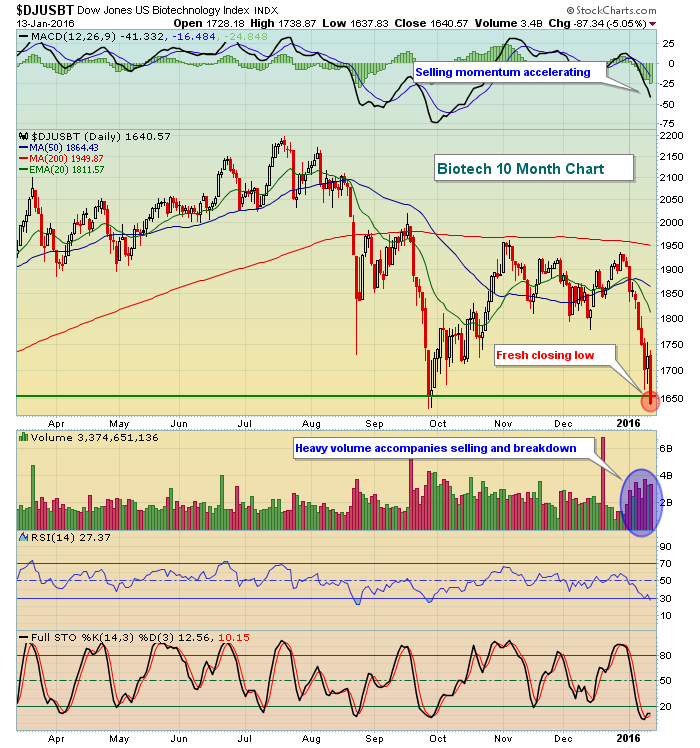
While there are plenty of industry group charts to choose from in illustrating yesterday's mass selling, the DJUSBT was appropriate because it reflects THE aggressive part of the healthcare sector. So long as money continues to pour out of riskier areas, a short-term bounce is likely all we'll see and all we should expect from a bull's perspective.
Our major indices finished the session down anywhere from 2.2%-3.5% as impulsive selling Wednesday afternoon gripped the market.
Pre-Market Action
It's somewhat ironic that much of our weakness lately has centered around the prospects of a weaker economy yet we've seen few economic reports to actually confirm it. This morning, initial jobless claims showed an unexpected climb to 284,000 providing the bears a little ammo. There'll be a plethora of economic reports out on Friday in the form of monthly retail sales, producer prices, empire state manufacturing, consumer sentiment, industrial production and capacity utilization. Throw in an earnings report after the close today from technology giant Intel (INTC) and news will be plentiful to open trading tomorrow.
This morning we're seeing slightly higher futures here in the U.S., but it's hard to trust anything after the impulsive selling to close out Wednesday. European markets are down in the 1.0%-2.0% range as they play catch up with the selling that took place in the U.S. late Wednesday. A key area to watch today will be banks ($DJUSBK). JP Morgan Chase (JPM) reported better-than-expected earnings this morning and the stock is higher by 2% in pre-market trading (at last check). The DJUSBK is at a very important support level on its weekly chart and needs to hold. Banks losing major long-term support will only fuel more selling in equities. Here's the visual:
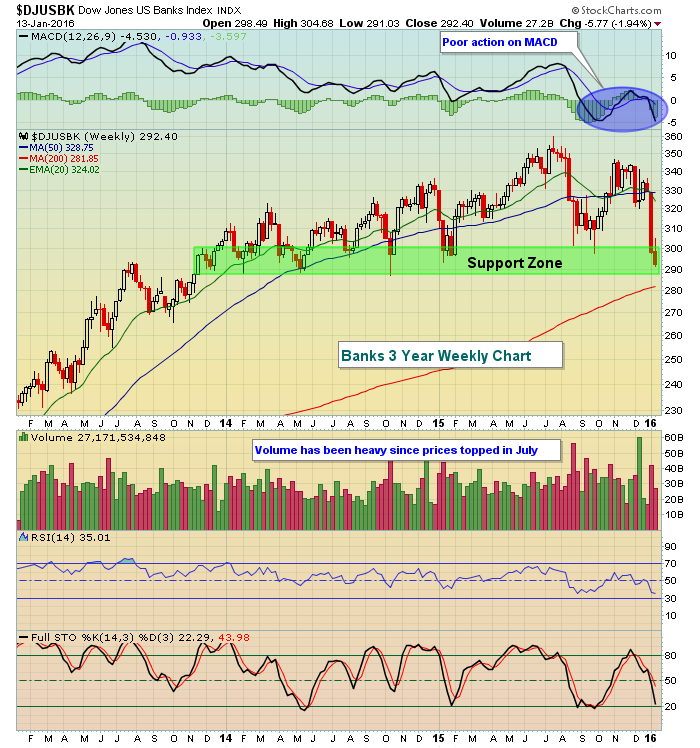
Loss of 285-290 support would be further confirmation that we're in a bear market vs. a correction, especially if it occurs after a better-than-expected report from a leader like JPM.
Current Outlook
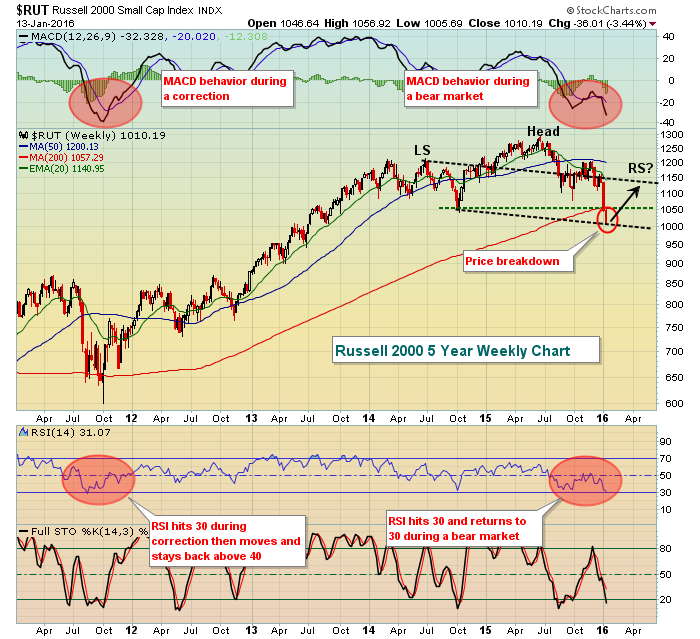
Yesterday, the Russell 2000 ($RUT) lost its October 2014 support as shown below:
Let me clear about one thing. Technical analysis NEVER provides us any guarantees of price action. I use it to determine probabilities and to manage risk. That's it. So when I see poor sector and industry group rotation or negative divergences or overbought/oversold conditions, etc, it alerts to me to a higher risk environment. It doesn't suggest any guarantees. Most folks that ignore technical analysis either don't understand it or downplay it because it errs at times. Use it appropriately - to manage risk.
Now back to that Russell 2000 chart above and a few points. First, note the difference in how the MACD has been acting now vs. October 2014. A correction is generally short-term in nature and the October 2014 was a perfect example. The MACD took a deep hit into negative territory but the return higher in stock price quickly reflected a positive weekly MACD as well. The fall in the MACD this past summer was similar to the October 2014 drop. But notice how the weakness currently has resulted in a new price low (and a low beneath October 2014)? The weekly MACD has also broken to fresh lows, indicative of accelerating momentum to the downside over the LONG-TERM. That rarely happens during a correction. The behavior of the weekly RSI also shows that momentum is different this time. Both the MACD and RSI is secondary to the combination of price/volume. But note that yesterday's impulsive selling resulted in a price breakdown. Simply put, there's nothing to like about the behavior of small cap stocks right now. And because small cap performance is a reflection of our domestic economic outlook, it's hard to feel very bullish right now.
The most bearish scenario would be a continuing steep drop in the near-term due to the loss of price support and a VIX in the 20s. There's a lot of fear in the air and that's when big market falls occur, as we're currently witnessing. The most bullish scenario for now would be the continuing formation of a downsloping head & shoulders pattern (black dotted lines) with yesterday's drop marking the right side of the neckline. That would set up for perhaps one more bounce to print a right shoulder near the declining 50 week SMA, perhaps in the 1100-1125 range.
While both of these scenarios is actually bearish, at least the latter would be more advantageous to establish short positions or to exit long positions.
Sector/Industry Watch
The Dow Jones U.S. Railroad Index ($DJUSRR) took another big hit on Wednesday after CSX reported its latest quarterly results. The results topped estimates, but its CEO acknowledged challenging conditions and the group continued its descent. A month or so ago, I featured the DJUSRR and pointed out a positive divergence on its weekly chart. Since that time, the downward spiral has continued and the positive divergence remains. While the group is clearly fundamentally challenged, it is approaching price support near 900 that could provide a short-term boost and slow the selling, if only temporarily. Check it out:
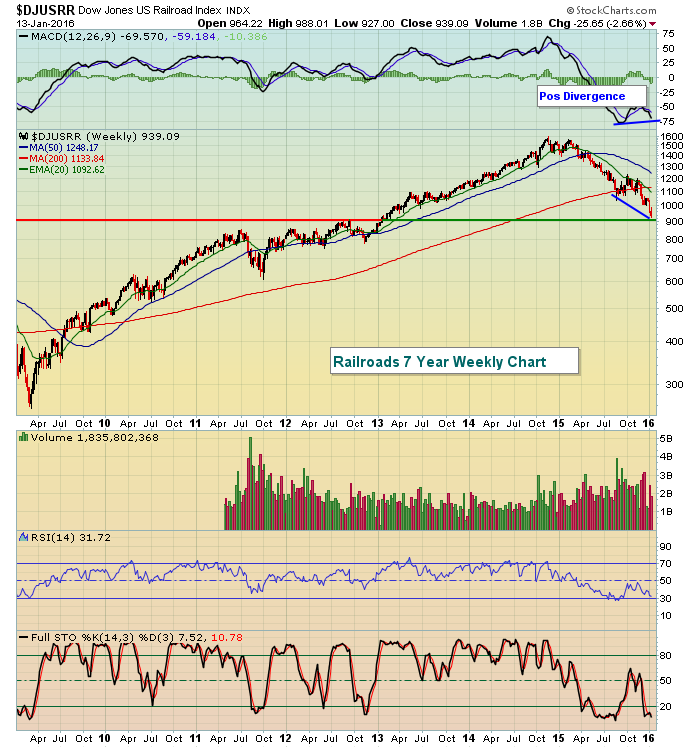
The green line near 900 represents support. If nothing else, it'll be interesting to see if buyers return at that level.
Historical Tendencies
Since 1988, the Russell 2000 has traded significantly different during two distinct periods of the calendar month. The following is the annualized return of these two periods:
From the 25th through the 6th: +36.68%
From the 7th through the 24th: -0.84%
Pretty amazing stat, huh?
This spans over a 27 year period and there have been over 7000 trading days included in this calculation so I'd certainly argue that it is statistically relevant. Put another way, 30% of the trading days on the Russell 2000 have accounted for 100% of the gains. And there are those who say that the stock market can't be timed? It's mostly about money flows folks - well, and of course a little greed. :-)
Key Earnings Reports
(actual vs. estimate):
GPN: .76 vs .74
JPM: 1.35 vs 1.29
(reports after today's close, estimate provided):
INTC: .63
Key Economic Reports
Initial jobless claims released at 8:30am EST: 284,000 (actual) vs. 275,000 (estimate)
Happy trading!
Tom


