Market Recap for Tuesday, January 5, 2016
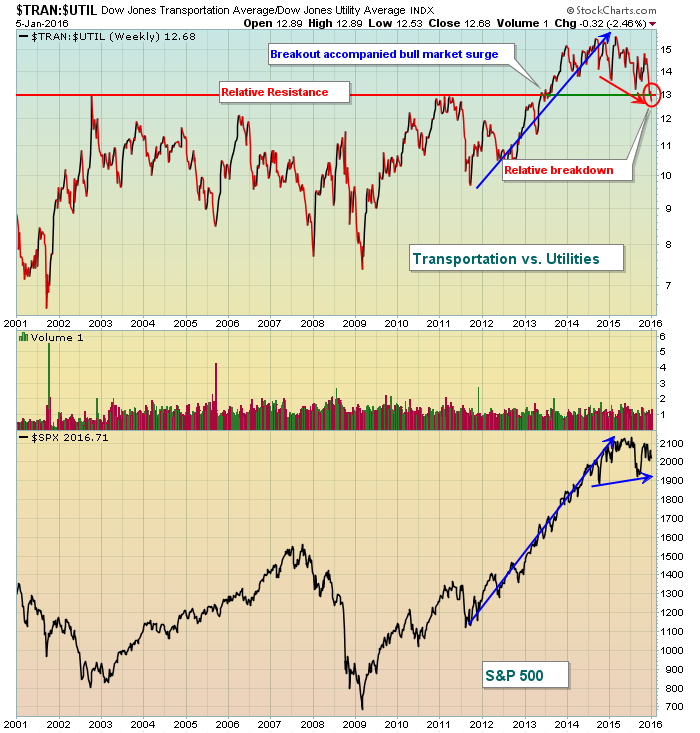
Let's start with the good news. After a big selloff on Monday morning, the U.S. stock market rallied into the close to print reversing candles across most of our major indices, sectors and industry groups. That was followed up with decent price action as three of our major indices finished with gains for the day. The NASDAQ was the lone exception and it was down just 11 points. Not bad action after the Monday selling, right? Wrong. One huge problem with Tuesday's "recovery" was that it was led by utilities, consumer staples and healthcare, our three defensive sectors. The bottom two sectors? Technology and consumer discretionary. Monday's selling produced opportunities for traders to move into growth stocks for the typical pre-earnings season rally (see Historical Tendencies section below for more details). Instead, buying was concentrated in defensive areas of the market. One telling chart is the loss of relative support of transports vs. utilities. Check this out:
This is just one piece of the puzzle when evaluating the health of the stock market, but it's been pretty clear for the past several months. Money is rotating away from stocks (transportation) that would do well in an accelerating economy to stocks (utilities) that are much more defensive and perform better in a stagnant or contracting economy. Even if you're hugely bullish the stock market, you have to ask yourself why money is rotating in this fashion. And it's not just this ratio that's the problem. I've pointed out in countless articles and webinars, this bias toward defense has been rearing its ugly head in the RUT:SPX (small caps vs. the benchmark S&P 500), XLY:XLP (consumer discretionary vs. consumer staples) and to a lesser degree the failure of treasury yields to clear recent highs. Simply put, the stock market is not currently buying what the Federal Reserve and Chair Yellen are selling.
Pre-Market Action
Overnight, China's Shanghai Composite ($SSEC) rose more than 2%, but other Asian markets failed to rally. In Europe this morning, most indices are down between 1.5%-2.0% and that weakness is carrying over here in the U.S. despite a better than expected earnings report from Monsanto (MON) and a much better expected ADP employment report that predicts 259,000 jobs vs. the consensus 190,000. Right now, the market is fearful and much more focused on potential bad news as earnings season approaches. Technical traders are also unloading positions as key support levels fail amid continued rotation toward defensive areas of the market. It's time to be very cautious.
Current Outlook
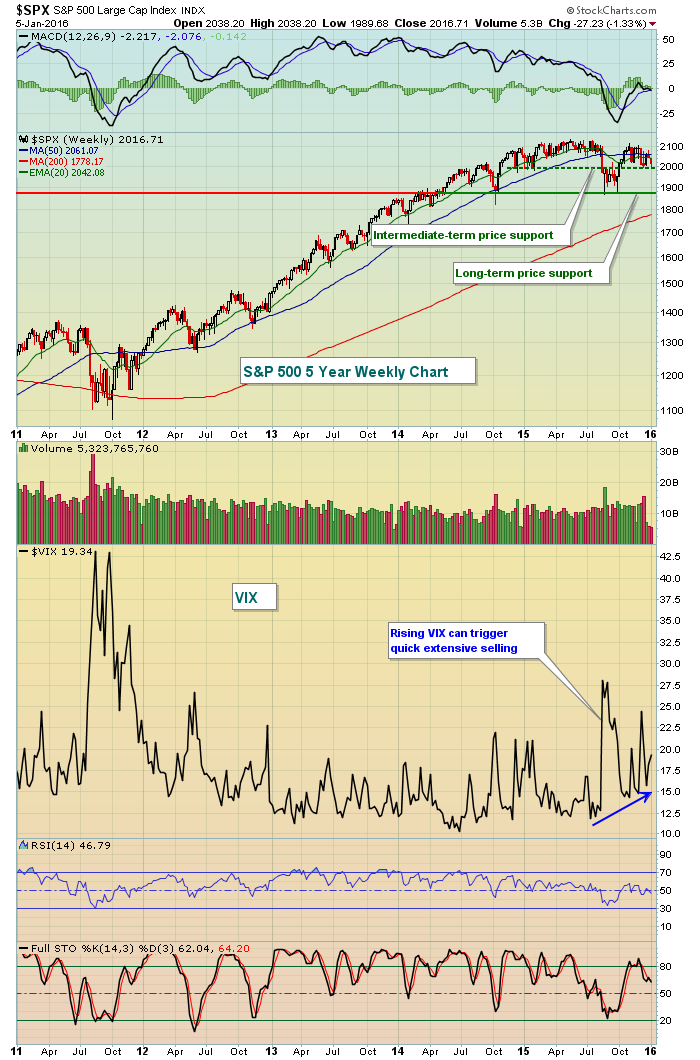
I break the market down into three distinct time frames: short-term, intermediate-term and long-term. Recent action has clearly been bearish as typical historical bullishness in December did little to send the U.S. market higher. In fact, the Russell 2000 sustained its worst December since the index began more than 25 years ago. Relative strength of aggressive areas of the market tumbled during December as well. It's difficult to paint a bullish picture near-term other than key price support holding. That one lone bright spot appears to be in serious danger given the state of U.S futures this morning. The S&P 500 looks to open beneath major intermediate-term price support at 1995. Barring a recovery and reversing candle, this breakdown opens the door to a selloff down to test long-term price support. The Volatility Index ($VIX) remains elevated and that normally suggests the potential for very rapid selling. Stock markets tend to move lower a lot faster than they move higher. There's a reason why bear markets tend to last 1-2 years while bull markets can surge for several years. Here's the S&P 500 currently as I see it:
While this weekly chart shows long-term support close to 1870 (lowest weekly close), on a daily basis, I'd peg the key price support to be closer to 1835-1840. In other words, on confirmed loss of intermediate-term price support at 1995, I would not be surprised at all to see the mid-1800s and the selling could be quick - similar to August 2015. And with the VIX back in the 20s, wild back and forth trading can be expected with large gaps to start our trading days.
Sector/Industry Watch
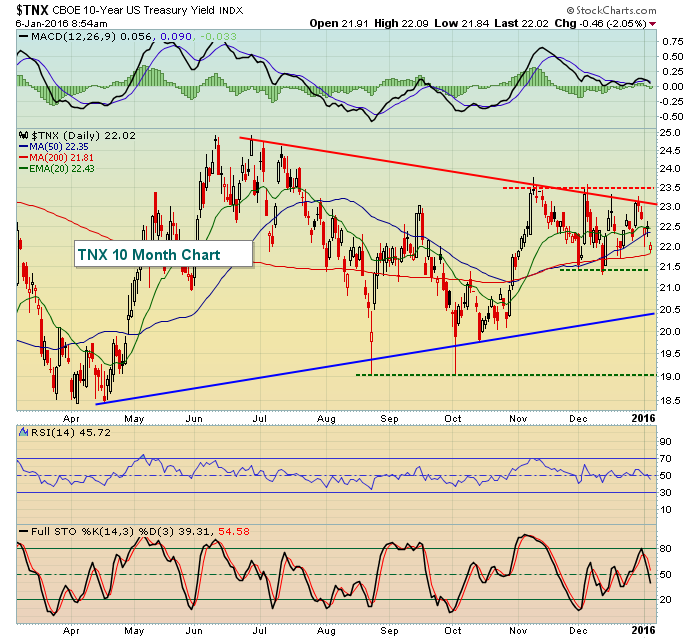
The bond market is not buying the Fed hype either. Trendline and short-term yield resistance reside at or near 2.30% and 2.35%, respectively. Despite a strong and much higher than expected ADP jobs report this morning, the TNX is down. That suggests to me that traders are ignoring economic news for now and instead focusing on global meltdowns and technical breakdowns. Here's the current look at the TNX:
The green dotted lines mark short-term yield support close to 2.14% while a much more important support level is at 1.90%. The red dotted line is the key short-term yield resistance near 2.35%. Everything in between 2.14%-2.35% is currently noise as a key battle continues to take place in bonds.
Historical Tendencies
The U.S. stock market definitely shows a bullish bias as it approaches earnings season. To illustrate, I'll use the S&P 500's historical prices. Understand a few things:
1. The S&P 500's average annual return has been roughly 9% per year since 1950.
2. The dates I've used to calculate pre-earnings annualized returns start on the 28th of the calendar month prior to earnings (December, March, June, and September)
3. The dates I've used to calculate pre-earnings annualized returns end on the 18th of the calendar month of earnings (January, April, July, October)
4. These start and end dates coincide with calendar year historical trends - for instance, the S&P 500 begins a very bullish period on the 28th of most calendar months and ends a bullish period on the 18th
Since 1950, here are the pre-earnings annualized return by quarter:
Quarter 1 (December 28 - January 18): +16.82%
Quarter 2 (March 28 - April 18): +21.12%
Quarter 3 (June 28 - July 18): +19.15%
Quarter 4 (September 28 - October 18): +11.61%
You can see that the pre-earnings annualized returns are higher than the 9% that the S&P 500 earns throughout the year. The first three quarters produce results close to or just above DOUBLE the normal returns. These numbers are statistically relevant. We don't always see pre-earnings rallies, but certainly the tendency is to do so.
Key Earnings Reports
(actual vs. estimate):
MON: (.11) vs (.27)
Key Economic Reports
December ADP employment report released at 8:15am EST: 257,000 (actual) vs. 190,000 (estimate)
November factory orders to be released at 10:00am EST: -0.2% (estimate)
December ISM non-manufacturing index to be released at 10:00am EST: 56.2 (estimate)
Happy trading!
Tom


