Market Recap for January 6, 2016
If the stock market could avoid the opening bell catastrophes, the action in 2016 wouldn't be bad at all. Thus far this year, the NASDAQ has had net gap downs of 173 points on a cumulative basis. Trading from 9:30am EST (opening bell) to 4:00pm EST (closing bell), however, has produced gains of 1 point! That has the smell of manipulation, but losses are losses and portfolios are getting beaten up rather badly. In yesterday's blog article, I pointed out that it was time to be cautious and that we could expect large gaps as expected volatility ($VIX) was at a level that can drive impulsive selling. Trading the stock market on a short-term basis right now isn't a whole lot different than sitting down at a craps table in Las Vegas. No thank you.
While aggressive areas normally are bought as earnings season approaches, that is not the case right now. The best three sectors on Wednesday were once again the defensive groups. Energy (XLE) was the big loser with price action falling back to test August price support at 58.26. Wednesday's close was 58.20 and volume was very heavy, suggesting serious distribution. Crude oil prices ($WTIC) are falling into the low 30s per barrel and that is likely to keep substantial pressure on energy shares. The Dow Jones U.S. Exploration and Production index ($DJUSOS) is featured in the Sector/Industry Watch section below.
All of our aggressive sectors finished down on Wednesday between 1.0%-1.5%.
Pre-Market Action
U.S. futures are tumbling this morning, following the lead of its Asian and European indices. The China Shanghai Composite ($SSEC) saw its shortest trading day ever with 7% losses triggering another early close there. That has spooked global markets, despite the fact that there's been little positive correlation between China and many of the other global indices. Still, the selling is real, fear is rising and further selling - perhaps quite impulsive - should be expected, at least until price support at August 2015 and October 2014 lows are tested. That will be a MAJOR test and likely the deciding factor on whether we remain in a longer-term bull market or if we've begun a period of deeper selling.
Continue to be cautious. Capital preservation is job 1 when fear is rising.
Current Outlook
The intermediate-term breakdown beneath 1995 price support on the S&P 500 has left the stock market vulnerable to further losses. The volatility index is on the rise and finished above 20 for the second time this week. A rising VIX is synonymous with selling and I'm expecting to see further price deterioration in the very near-term as the S&P 500 searches for a bottom. The August 2015 price low is very important because that low was established with a heavy dose of fear (the VIX hit 50 - an extremely high reading historically). Typically, panicked selling doesn't abate until we see capitulation, normally a very heavy volume reversal at or near key price support. The very weak futures this morning is likely to move us one step closer to that low.
Money has been rotating in very bearish fashion for months so that supports the notion of a potential bear market looming. Many have already called this a bear market. I don't for one very simple reason. A bear market isn't confirmed until we experience a lower price low. For now, I'm treating this as a bearish short- and intermediate-term breakdown that's likely to lead to much more short-term selling, but I believe it's still premature to call this a bear market. Transportation stocks ($TRAN) are signaling more weakness ahead as they've already cleared October 2014 and August 2015 lows. Take a look:
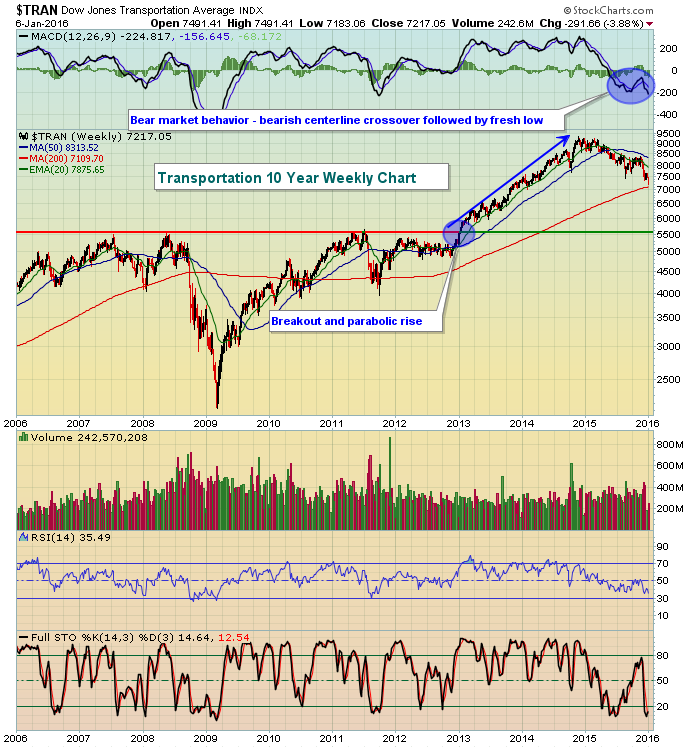
If you're in the bear market camp, you don't need to look much further than transportation stocks to support your argument. After all, what could possibly send a stronger signal about the future direction of our economy? Also, transports experienced a parabolic rise where the index rose nearly 100% from late-2012 to late-2014. It's been a struggle ever since as money has rotated away from this group. I've detailed on many occasions the relationship between transports and utilities ($UTIL) by plotting the $TRAN:$UTIL ratio on a chart. That ratio just experienced a relative breakdown this week so most signs point to lower transportation prices. It's difficult to imagine the stock market resuming its 7 year bull market without the support of transportation stocks so this remains a critical index to keep an eye on.
Sector/Industry Watch
Energy (XLE) is clinging to August price support and whether it holds is dependent on one influential industry group - Dow Jones U.S. Exploration and Production index ($DJUSOS). Take a look at this chart:
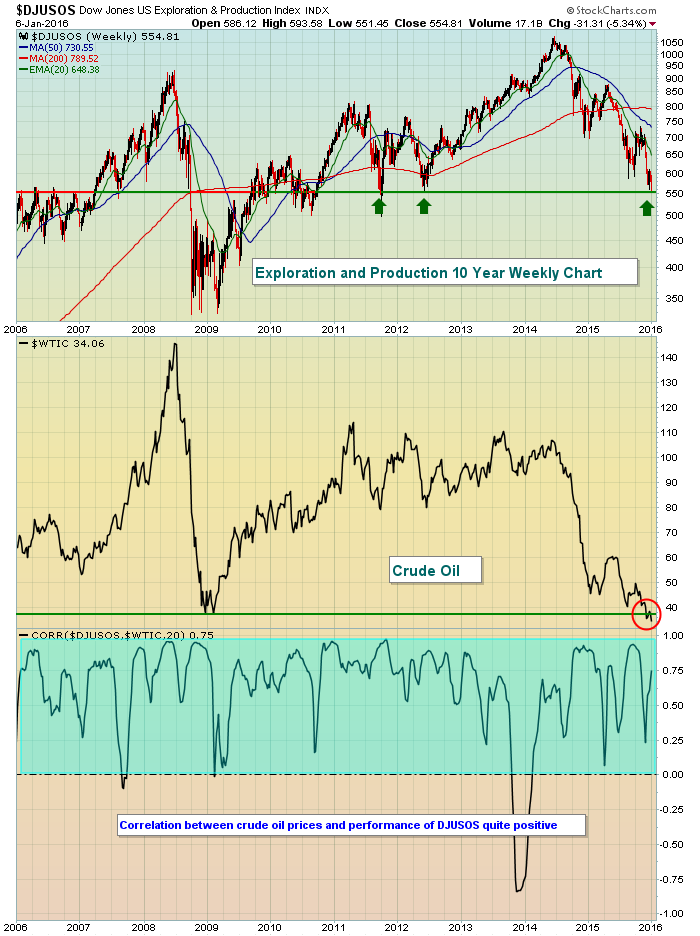
There is clearly a positive correlation between the DJUSOS and the price of crude oil ($WTIC). Given the fact that the WTIC is breaking beneath price support, it stands to reason that the DJUSOS is likely to see further technical damage in the weeks ahead.
Historical Tendencies
The Russell 2000 has more bearish tendencies in early January than its counterparts, the S&P 500 and NASDAQ. The 7th through 9th of January does tend to show some bearishness on the S&P 500 as those three days have annualized returns of -9.56%, -30.94% and -58.45%, respectively, since 1950. While the Russell 2000 also shows those bearish tendencies this time of the month, the NASDAQ does not. Its annualized returns for these three days is +41.79%, +2.07% and -15.82%, respectively, since 1971. In my opinion, the primary reason for those negative returns is likely profit taking from gains earlier in the month. January 2016 has been different, however, in that the month has started off with big losses so profit taking won't be an issue. Still, the market is broken technically in the short- and intermediate-term and the door is open to further selling near-term.
Key Earnings Reports
(actual vs. estimate):
KBH: .43 vs .51
STZ: 1.42 vs 1.29
(reports after closing bell, estimate provided):
BBBY: 1.09
Key Economic Reports
Initial jobless claims released at 8:30am EST: 277,000 (actual) vs. 272,000 (estimate)
Happy trading!
Tom


