Market Recap for Tuesday, January 19, 2016
Coming off the long holiday weekend, U.S. futures were poised to try to reverse the ugly behavior of equities thus far in 2016. And they did - for roughly 60 seconds. In just another awful performance for equities, the Russell 2000 once again led the downside action. In case you haven't noticed, the Russell 2000 has underperformed the S&P 500 every day since December 24th with one exception late last week. Check out this rather simple chart:
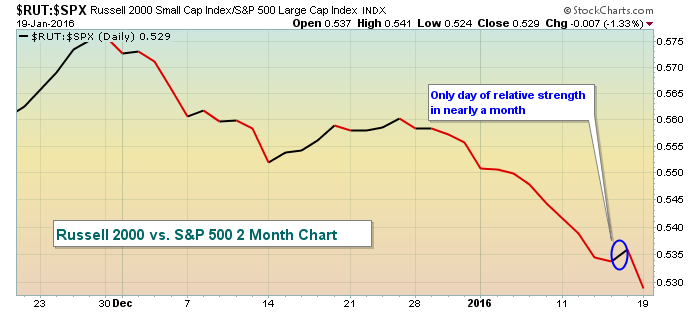 If you're unfamiliar with using relative ratios here at StockCharts, the above chart plots the relative performance of the Russell 2000 vs. the S&P 500 ($RUT:$SPX). It doesn't mean that the Russell 2000 is going down every day. It means the Russell 2000 is going down relative to the S&P 500. The decimals to the right side of the chart are calculated by dividing the Russell 2000 index value (994.87 at Tuesday's close) by the S&P 500 index value (1881.33 at Tuesday's close). That result (.528812) is rounded to .529 and shown as the closing relative value above. That's the calculation.
So what does it mean? Well, to me it means two things. The Russell 2000 is comprised of smaller, more volatile stocks so the reluctance to own these companies relative to the S&P 500 tells us that traders are in a "risk off" mode and that's much more conducive to bearish market action. The second take away from this relative behavior is that the U.S. economy appears to be weaker than what the Fed is telling us. Small companies tend to do most, if not all, of their business here in the U.S. The S&P 500 is made up of multi-national businesses that do business globally. There's a much stronger correlation between S&P 500 performance and the global economic outlook. I view the relative weakness of the Russell 2000 as a sign of deteriorating economic conditions here vs. those seen throughout other parts of the world. Bottom line, I want to see this ratio rising and that's clearly not the case currently.
The action on Tuesday was bifurcated with both the Dow Jones and S&P 500 rising while the NASDAQ and Russell 2000 (the two more aggressive indices) stumbled badly. Utilities (XLU) and consumer staples (XLP) showed excellent strength, gaining 1.50% and 1.20%, respectively, on the session. Unfortunately, that again wreaks of rotation into defensive areas of the market and therein lies the big problem.
Pre-Market Action
Well, the up and down futures game continues. The high volatility ($VIX) leaves us wondering on a daily basis what we're going to wake up to. Thus far in 2016, we've seen four gaps lower on the NASDAQ totaling a whopping 437 points and we're set to see another large gap lower this morning. But shorting overnight isn't the answer either as we've seen seven gaps higher this year totaling 220 points. You really have to have a gambling mentality to be an active trader in this market environment.
In Asia, the Hang Seng ($HSI) and the Nikkei ($NIKK) both tumbled and lost nearly 4% overnight and European indices are also under heavy pressure.
Earnings are not exactly lighting a fire under futures either and the December housing starts came in below expectations. Let's see how the market reacts to more global, economic and earnings pressure.
Current Outlook
If under the surface signs remained even mildly bullish, I'd argue that price support on our major indices has been holding and I could remain cautiously bullish. But that isn't the case. Nearly every technical sign and intermarket relationship is pointing toward lower prices. The last ingredient is the price breakdown. One of the most notable signs of economic weakness ahead is the recent breakdown in the Dow Jones U.S. Banks Index ($DJUSBK). The stock market has a history of struggling when the DJUSBK is technically broken. Perhaps the most surprising part of this breakdown is that the large banks have thus far reported excellent quarterly results, routinely beating EPS estimates. But remember, the stock market looks ahead. What could the market be telling us? Maybe it's the fact that so many energy and materials companies are struggling with collapsing crude oil ($WTIC) and other commodity prices. Many companies in these two sectors are trading for a tenth of what they traded for a year ago. Many of them have piles of debt. Could the technical woes in banking be telling us of the risks associated with those loans? Maybe. I try not to concern myself with the "why" questions. I simply recognize the technical weakness and react to it. I'm 100% cash and that's where I'm staying for now.
Here's the DJUSBK breakdown:
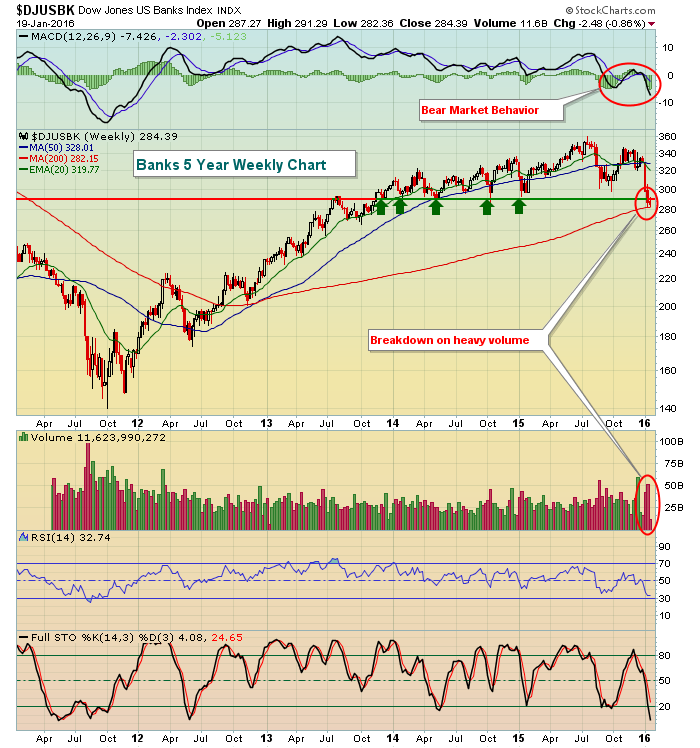 The 290 support level had held for two years so losing it on increasing volume is a bad sign technically. The entire market is oversold so a bounce could be in the cards. However, I'd expect sellers to step back in on any strength to 300-310 as I believe the trend here is now lower.
Sector/Industry Watch
Yesterday I featured the Dow Jones U.S. Residential REITs Index ($DJUSRN) which has remained bullish throughout the recent market downturn. Utilities have been very strong on a relative basis - and even on an absolute basis - as the Dow Jones U.S. Water Index ($DJUSWU) reflects below:
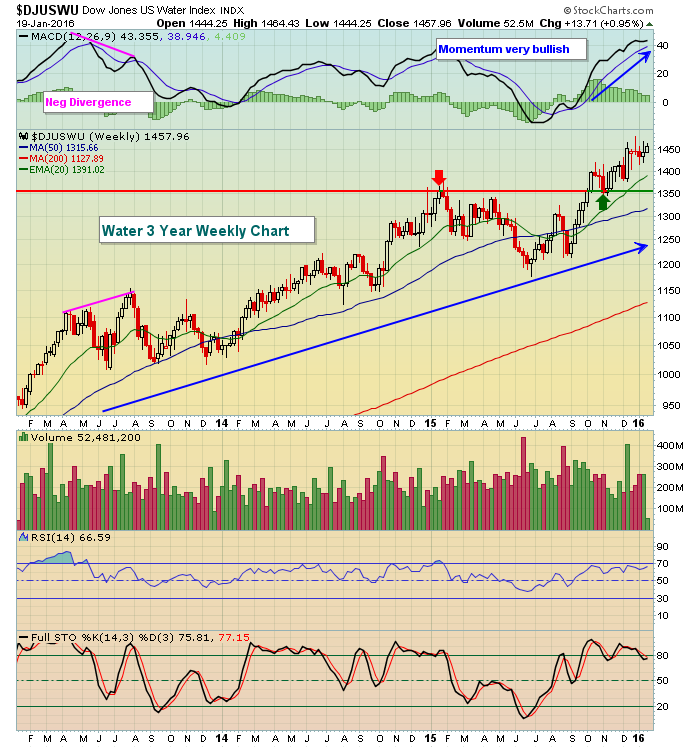 The MACD shows excellent momentum on the weekly chart. That usually suggests that a pullback to test the rising 20 week EMA is solid reward to risk entry. One word of caution. After a pullback, the next price high could result in a lower MACD reading, similar to the one that developed in mid-2013. That resulted in 6 months of frustrating sideways action. For now, however, this chart looks bullish and is likely to perform well on a relative basis given the economic signals being sent.
Historical Tendencies
Well, it's the 20th of the calendar month. The bullish periods earlier in the month didn't pan out so the bulls can only hope that historical headwinds this time of the month don't work out either.
Key Earnings Reports
(actual vs. estimate):
AMTD: .39 vs .36
GS: 4.68 vs 3.79
NTRS: .99 vs .91
(reports after close, estimate provided):
FFIV: 1.27
KMI: .17
XLNX: .48
Key Economic Reports
December CPI released at 8:30am EST: -0.1% (actual) vs. +0.0% (estimate)
December Core CPI released at 8:30am EST: +0.1% (actual) vs. +0.2% (estimate)
December housing starts released at 8:30am EST: 1,149,000 (actual) vs. 1,200,000 (estimate)
December building permits released at 8:30am EST: 1,232,000 (actual) vs. 1,217,000 (estimate)
Happy trading!
Tom


