Market Recap for Tuesday, January 13, 2016
There were a few positives regarding the rally on Tuesday. First, all of our major indices finished in the green for the first time in 2016. Whew! The better news is that aggressive areas of the market benefited most and that should provide the bulls enough confidence to extend the gains near-term. Looking at an intraday hourly chart, there are two price levels where I'd look for prices to gravitate toward. The chart below illustrates those two levels on the S&P 500:
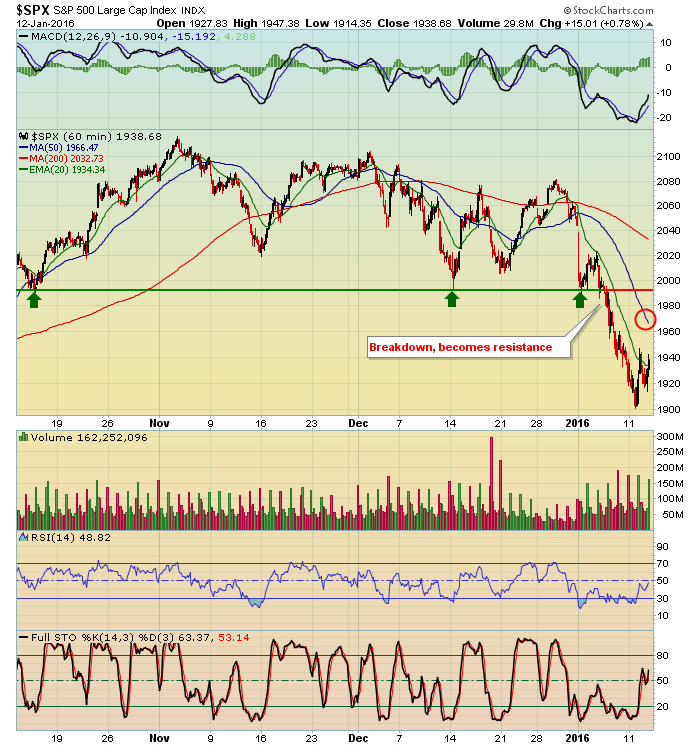
The three green arrows mark multiple tests of price support near the 1995 level. That prior support becomes resistance after the breakdown so ultimately that level, if we get there, would represent a high reward to risk for shorting as a close above 1995 and the declining 20 DAY EMA (currently 2005 as shown below in the Current Outlook section). During any downtrend, a key initial test resides at the declining 20 period EMA. So on the hourly chart above, the S&P 500 successfully closed above its falling 20 hour EMA, a short-term positive for sure. But the red circle highlights the falling 50 hour SMA, the next key moving average. A move through that moving average really leaves little resistance until that 1995 price resistance level.
Action evolved positively throughout the day on Tuesday. The initial gap higher wasn't really supported by aggressive stocks. In other words, traders weren't in "risk on" mode to start the day and that initial strength failed to hold. During the last two hours, however, the rally was led by more aggressive areas as biotechs ($DJUSBT) rallied to lead healthcare (XLV) and technology (XLK), consumer discretionary (XLY), industrials (XLI) and financials (XLF) all were strong and finished second through fifth in terms of sector performance. It's been a LONG time since the market behaved in this fashion and it bodes well for further gains in the market.
Pre-Market Action
U.S. futures are up and traders appear prepared to extend the gains from Tuesday's final two hour rally. European markets are also higher this morning so that's clearly helping the U.S. extend its gains. Germany's DAX ($DAX) has been trending lower, but is quickly approaching its uptrend line in a long-term bullish symmetrical triangle pattern. Failure to hold this support will add further pressure to global markets. Here's the visual:
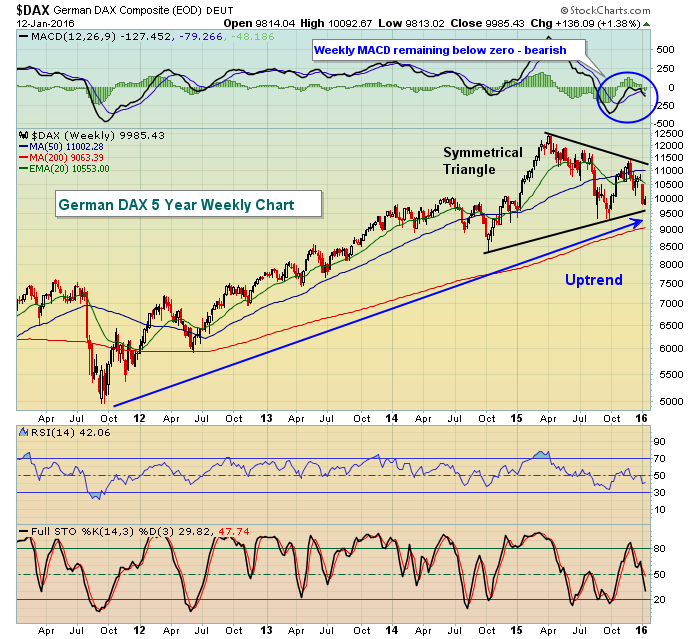
As explained on multiple occasions, there's a positive correlation between the German stock market and the U.S. stock market so we need to keep an eye on technical developments in Germany. The long-term bull market remains intact but there are clear technical issues that could favor a bear market ahead - most notably a weekly MACD that's been in negative territory for nearly six months.
Current Outlook
On the following daily chart on the S&P 500, note that the declining 20 day EMA is rapidly dropping and isn't far from key price resistance at 1995. That combination will be powerful resistance for the bears on any further rally attempt. In fact, given the deterioration in nearly every below the surface signal I watch, this 1995-2000 area is perhaps the best reward to risk entry point on the short side. If a rally does occur to that level and money begins to rotate away from aggressive stocks and into more defensive areas as we've seen in recent months, that's a further clue that the rally likely won't last. Here's the current chart and how I see it:
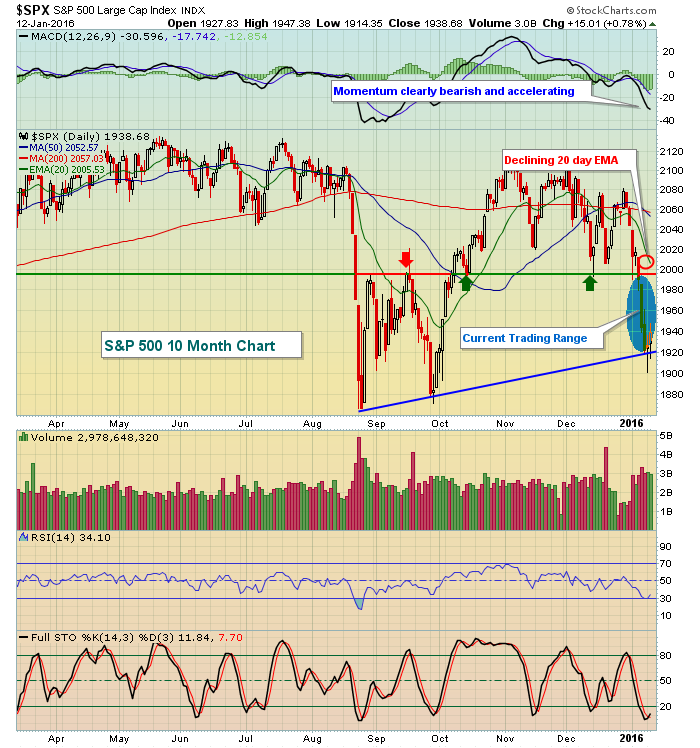
The red arrow marked price resistance at 1995 in September. Then the two green arrows marked support at 1995 in October and again in December. The recent loss of 1995 price support to open this year was accompanied by heavy volume. As a result, 1995 should now become formidable resistance on any rally and rebuff the bulls. I've highlighted the current trading range to be roughly 1920-1995 as trendline support and last week's closing low intersect near that 1920 level. If that support is lost, look for a full retest of the October 2014 low. The Volatility Index ($VIX) is in an uptrend and currently resides above 20, so literally anything goes. Be prepared for whipsaw action just as we saw on Tuesday. Your nerves are likely to be tested.
The short-term and intermediate-term are both bearish with only the October 2014 price lows offering support to maintain a bullish stance there. I've highlighted the deterioration of intermarket relationships in the Sector/Industry Watch section below. This poor relative performance indicates that traders' collective opinion regarding the stock market's prospects for 2016 have changed considerably - and for the worse.
Sector/Industry Watch
The following intermarket relationships illustrate the erosion under the surface of the stock market. It's not just about whether the S&P 500 is rising or falling. It's just as important to see where the money is moving to determine what market participants are expecting in 2016. Remember, the stock market is a strong economic indicator as it always tries to price in future economic developments. It doesn't look in the rear view mirror. With that in mind, check out the rotation recently in these key intermarket areas:
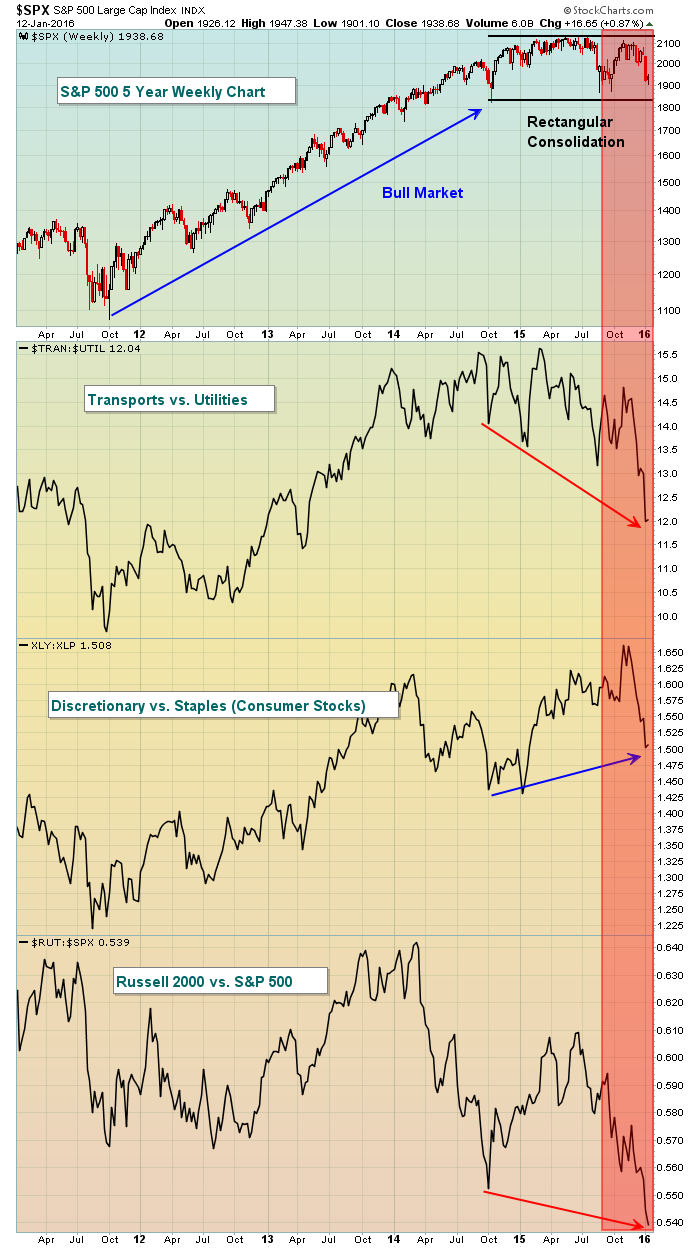
The price pattern on the S&P 500 is actually quite bullish. After a four year uptrend, there's absolutely nothing wrong with a basing, rectangular pattern. It's not the S&P 500 price action alone that worries me. It's the underneath the surface action where money has been rotating toward defense since October 2014, with consumer stocks being the lone exception. But if you look at the red highlighted area, you'll see MAJOR deterioration since the August 2015 lows. Money is quickly rotating toward defense. Until that changes, it's very hard to follow the price action alone and remain bullish. While a short-term bounce is in order, we'll need to watch how the intermarket relationships develop during such an advance.
Historical Tendencies
On Monday, I showed the annualized returns on the S&P 500 for the calendar days from the 11th through the 18th (not just January, but all months). The NASDAQ shows even more bullishness, check out these annualized returns since 1971:
11th: +23.57%
12th: +13.64%
13th: +30.00%
14th: +6.33%
15th: -4.91%
16th: +35.10%
17th: +9.87%
18th: +22.32%
Key Earnings Reports
(reports after close today, estimate provided):
INFY: .23
Key Economic Reports
None
Happy trading!
Tom


