Market Recap for Friday, February 12, 2016
The Dow Jones U.S. Banks Index rallied nearly 6% on Friday, a stunning reversal with a positive divergence indicative that the rally may be closer to starting than finishing. The entire financial sector rallied with the benchmark ETF (XLF) gaining 4.22% on the session. The Dow Jones U.S. Life Insurance Index ($DJUSIL) climbed 4.70%. Both banks and life insurance companies generally perform better during periods of rising interest rates. On Friday, the 10 year treasury yield ($TNX) soared more than 10 basis points after closing at its high following a massive turnaround on Thursday. The following chart shows the TNX reversing its fortune on Thursday, setting up a buying frenzy in banks and life insurance:
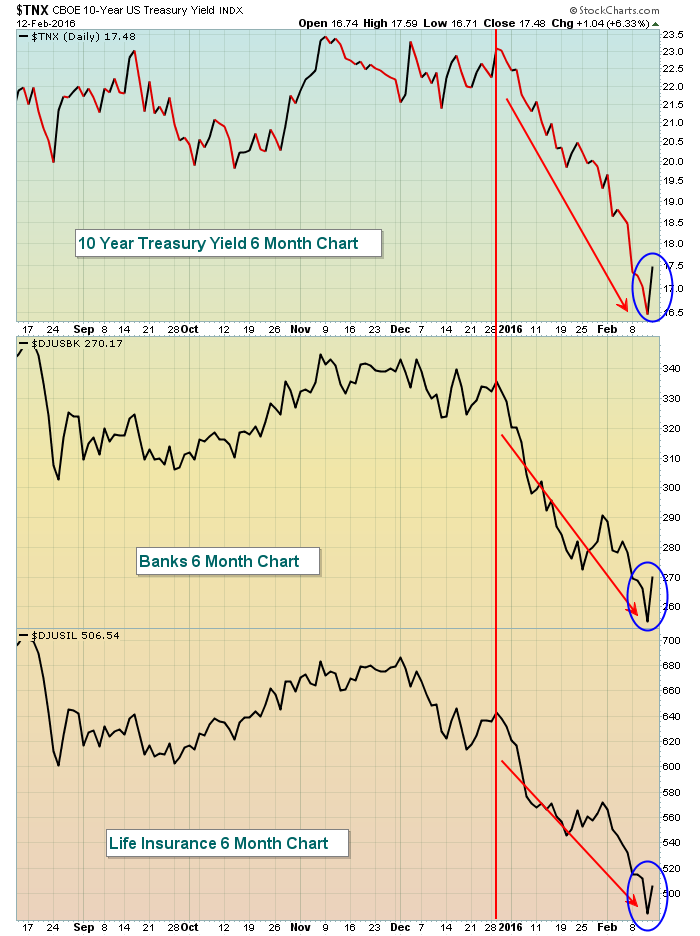 You can see that the drop in the TNX began the last couple trading days of 2015. That's exactly when both banks and life insurance companies began their steady decline as well. Thursday's reversal in treasury yields encouraged buyers on Friday as the DJUSBK and DJUSIL led action to the upside.
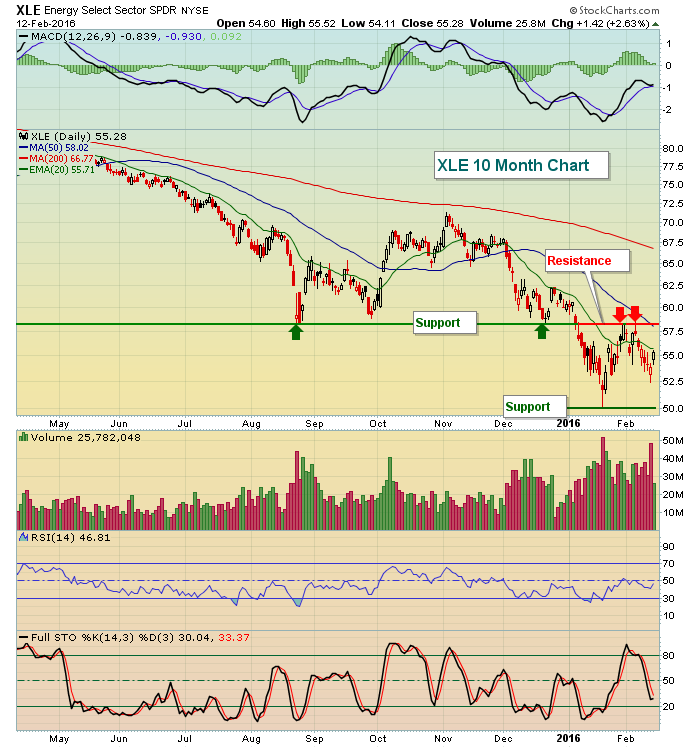
Crude oil ($WTIC) rose more than 6% on Friday as energy (XLE) rebounded sharply. The XLE was up 2.63% as it's now trapped in a 50.00-58.00 trading range. Here's the current technical picture:
Eight of nine sectors rose Friday with utilities the only sector losing ground. Utilities benefited from the tumbling yield, so it only made sense that this sector faltered on a major bounce in the TNX.
Pre-Market Action
Please note this report is being written today earlier than usual - a few hours before the U.S. stock market opens so futures could change dramatically.
Across the pond on Monday, European Central Bank President Mario Draghi hinted at further stimulus, saying "we're ready to do our part....to make the euro area more resilient." That, combined with discussions/rumors of oil producers cutting production and Friday's U.S. stock market rally, provided the impetus for a global rally the past two days. While the U.S. market was closed on Monday for President's Day, Tokyo's Nikkei ($NIKK) soared, rising over 1000 points, or 7.16%. Hong Kong's Hang Seng index ($HSI) rose more than 3%. Last night, the gains were not nearly as impressive as traders soaked in Sunday night's massive jump.
In Europe, Monday was also a very strong day although there's been some difficulty to extend those gains this morning. The German DAX ($DAX), for instance, rose 2.67% on Monday, but has failed to add anything this morning. At last check, the DAX was down 0.64% after trading in positive territory earlier in the session. I've documented the tight positive correlation between the DAX and the S&P 500 so it will be important to watch to see if the DAX can negotiate overhead price resistance and the declining 20 day EMA as reflected on the following chart:
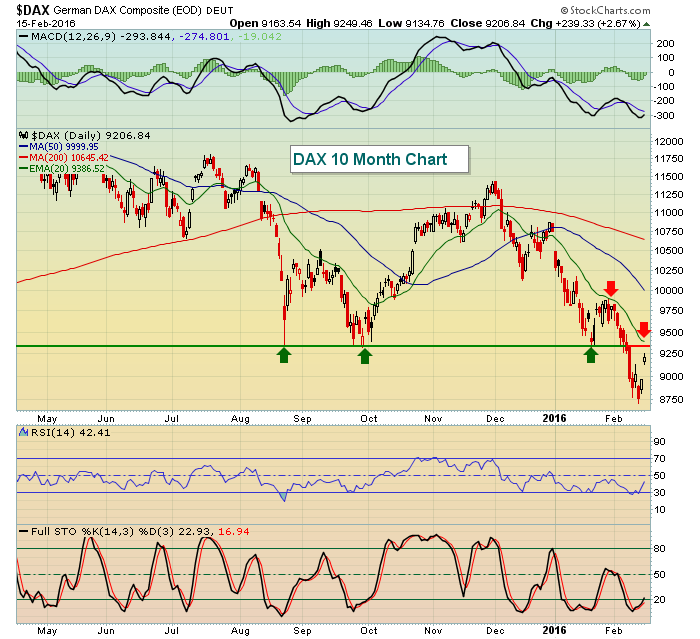 Price support was quite strong near the 9350 level as those three green arrows highlight. The first test of price resistance at that level will coincide with a 20 day EMA test, making it doubly difficult for the bulls. A break above 9350 would add to the short-term bullishness here in the U.S., while failure could act as a major headwind for the S&P 500.
As of 7:45am EST, U.S. futures are very strong with the S&P 500 up 26 points and the NASDAQ up 72 points. There were a number of factors recently that pointed to strength at the end of last week and into this week. A few of those points were summarized in my Friday morning blog article, "Why This Rally Could Last A Bit Longer". We should definitely expect more volatility and whipsaw action, although the near-term bias is likely to remain positive.
Current Outlook
I believe we're in a bear market, awaiting only the S&P 500 price breakdown to confirm all the other bear market signals given the past 8-10 weeks (ie, market rotation to defense). Therefore, we MUST make sure we keep trailing stops in play. Don't allow gains to evaporate or turn into losses, especially big losses. On a 60 minute chart, I'll highlight a few areas to be thinking about during this rally:
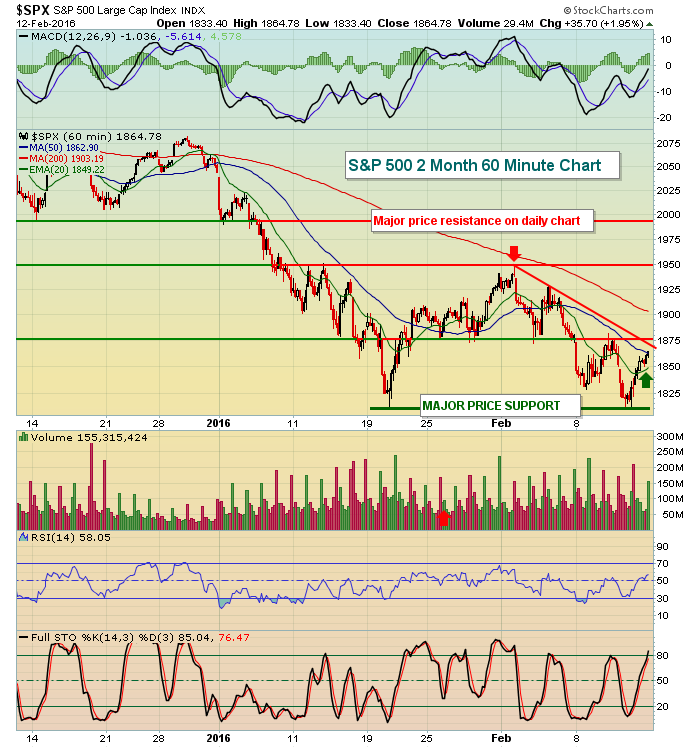 First, let's talk support. There's a clear double bottom in place just above 1800 so respect a high volume move below that level. Also, with today's gap higher (at least based on where futures currently stand), 1875 resistance will be cleared and that should provide support on pullbacks, along with the now-rising 20 hour EMA. Now resistance. In addition to price resistance at 1875 being cleared, today's open should easily clear the recent trendline resistance. The next price resistance level is between 1925-1930 and I fully expect to get there. The reaction high off the January low was in early February near 1950 (red arrow). That should be much more formidable resistance. Our ability to break above 1950 will be somewhat dependent on sector rotation. If money remains defensive, I doubt we'll clear 1950 on this run. If money turns more aggressive, then a major resistance level at 1995 on the daily chart would become the target. I would become more aggressive on the short side at 1950 and 1995. For now, I'll remain cautiously long for a trade.
Sector/Industry Watch
Financial stocks (XLF) led the rally on Friday and there's reason to believe this group can continue to fuel a short-term rally. The last time the XLF showed equal prices with a higher MACD reading on its daily chart, it rallied more than 10% in five weeks. Currently, the XLF has a higher MACD reading with a lower price. I'm not sure we'll see the type of ensuing gain we saw in October, but a few more days of strength isn't too far fetched. On Friday, I highlighted the positive divergence on the XLI (industrials ETF) chart. Here's a current look at the XLF:
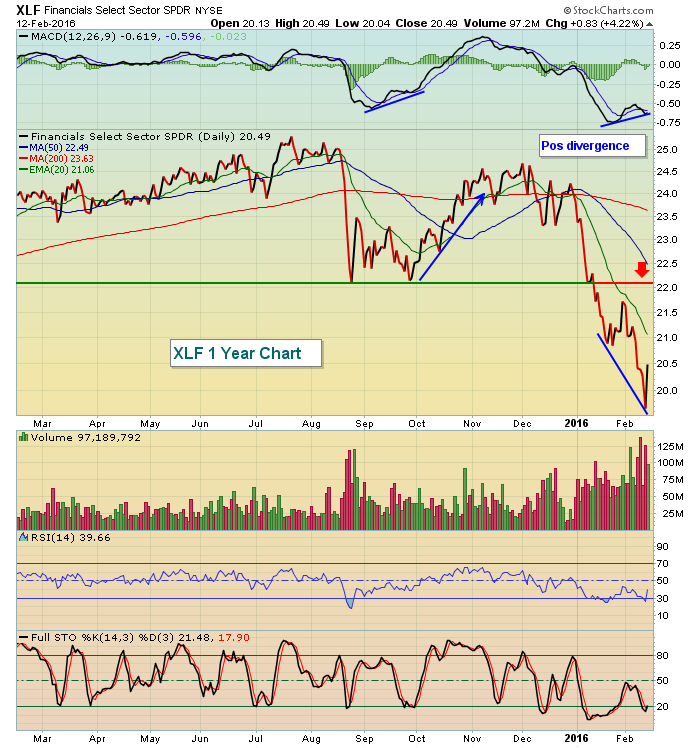 A close above the declining 20 day EMA, currently at 21.06, would add to the likelihood of a 50 day SMA test and a potential MACD reset at its centerline.
Historical Tendencies
Since 1950, the 16th day of all calendar months has produced annualized returns of 31.09%. That qualifies as a strong day when you consider that the S&P 500 has gained roughly 9% a year over that same time frame. Only the 1st, 2nd and 31st days of the calendar month boast stronger annualized returns than the 16th.
Key Earnings Reports
(reports before open, estimate provided):
GPC: .99 (had not reported as of the release of this article)
(reports after close, estimate provided):
A: .43
DVN: .74
ESRX: 1.55
PSA: 2.42
RAX: .23
VNO: 1.29
Key Economic Reports
February empire state manufacturing survey to be released at 8:30am EST: -10.00 (estimate)
February housing market index to be released at 10:00am EST: 61 (estimate)
Happy trading!
Tom

