Market Recap for Tuesday, February 16, 2016
Tuesday produced what arguably was the best daily performance for U.S. equities in 2016. It wasn't the biggest percentage gain, but the behavior and leadership was outstanding and sets up the market for further short-term gains. Yesterday's leadership, from an index standpoint, came from the Russell 2000 (+2.45%) and NASDAQ (+2.27%). These two aggressive indices have been lagging in 2016 so strength returning was a welcome sign. Furthermore, check out the sector strength. When was the last time that discretionary, industrials, technology and financials all were in the top 5 sectors for a day? The only real blemish in terms of sector leadership was healthcare (XLV) occupying the #3 spot. But a look under the surface reveals that biotechnology ($DJUSBT) led healthcare and biotechs are most definitely an aggressive bunch.
Okay, now let me bring everything back down to earth. This is not likely to last and every day of strength raises the bar in terms of the risk of holding stocks on the long side. As I look inside the various aggressive sectors, recent leaders are no longer outperforming. Instead, much relative strength currently is coming from groups that are technically broken. For instance, consider technology. The two worst performing industry groups within technology were internet ($DJUSNS) and software ($DJUSSW), two stalwarts during the bull market. The leader yesterday in technology? Consumer electronics ($DJUSCE). This is a beaten down group that saw 5% relief yesterday. Check out the chart:
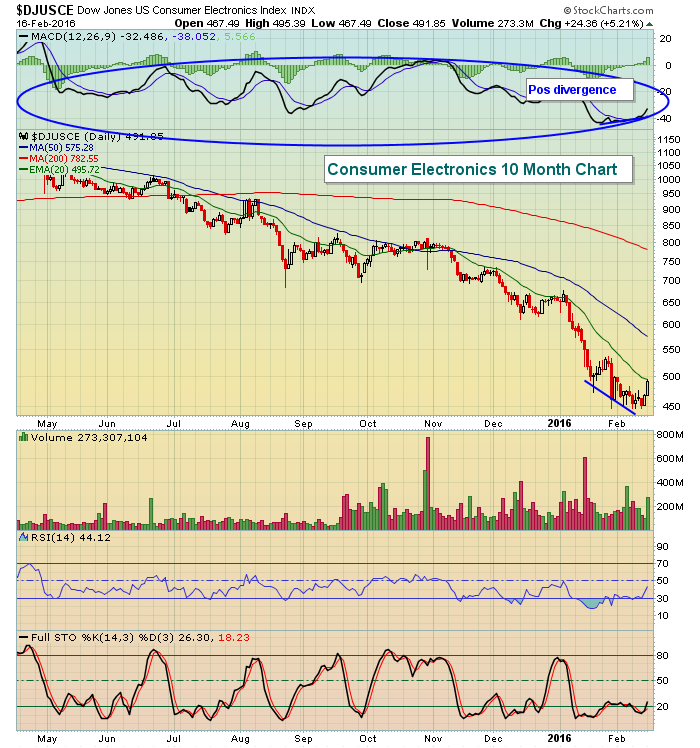 While the recent strength could continue given the positive divergence on the MACD, this does not appear to be a group technically capable of carrying the market higher in the near-term. The MACD has been negative for the past 10 months, indicative of selling momentum. The current slowing momentum on the sell side could result in another 10% of short-term upside, but I'd be careful assuming we'll see more than that. And the 10% further upside is no guarantee for sure.
For the first time in awhile, risk off took a back seat. Consumer staples (XLP) and utilities (XLU) were the worst performing sectors on Tuesday. The XLU had recently broken out and the rising 10 year treasury yield ($TNX) the past few days have caused utility bulls to pause and take some profits. This group tested its 20 day EMA yesterday and is attempting a bounce. The combination of the 20 day EMA and price support is likely to provide some near-term support. Check it out:
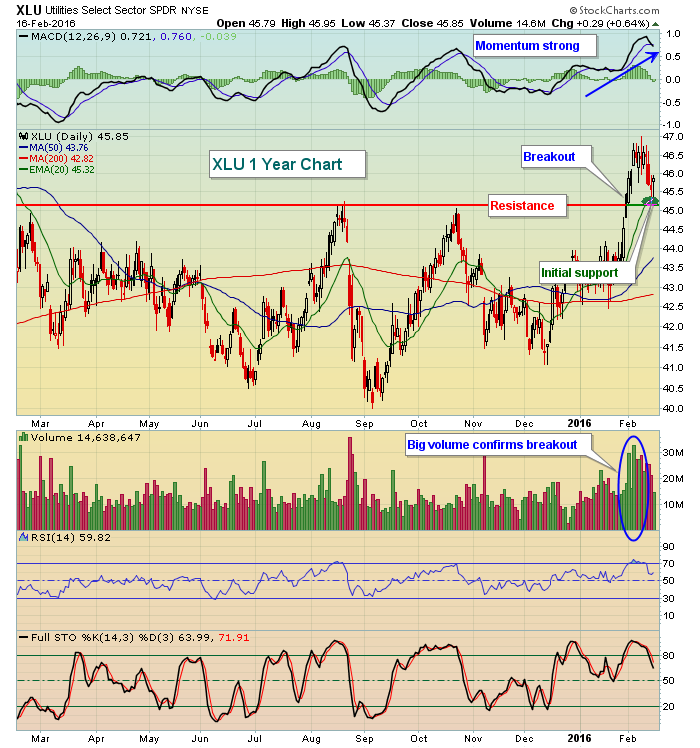 Utilities are well deserving of a little profit taking. If you're in the bullish camp, you'd like to see a breakdown in the XLU as money continues to rotate toward aggression. We'll see.
Pre-Market Action
U.S. futures are very strong once again as our major indices look to clear declining 20 day EMAs in today's action. I'm expecting that because of the positive divergences that have been printing nearly across the board. Slowing sell side momentum has allowed the bulls to regain control of the short-term action. Keep an eye on rising 20 hour EMAs as the first key level of defense for the bulls during any period of selling. I'll continue raising my stops under my long positions so that the first sign of bear market resumption stops me out. Try to avoid emotional trading and remain objective looking at the longer-term deterioration under the surface.
Current Outlook
Let's compare current market conditions to what we saw in 2007 before the collapse. Before we do, however, please understand two things. First, what happened in 2007 does not guarantee us we'll see a repeat. I'm looking at the similarities and exercising caution by trading on the long side temporarily and with very tight stops. Second, price support has NOT been lost yet. There's still the possibility that the seven year bull market resumes. I just don't believe it will happen because of the last three months' mass exodus out of risky assets. That's not normal bull market behavior. Rather, it's a signal that rough roads lie directly ahead so that's what I'm preparing for. My trading strategy has completely flipped. Instead of using weakness to buy positions and only trade on the long side, I'm now planning to use strength to build short positions.
With all that said, here is the current weekly look at the S&P 500, followed by a chart showing what transpired in the 2006-2008 period. I've identified a few strikingly similar features of the two charts and what we might look for in the weeks ahead based on what we saw then. Obviously, we're in two different periods of time, but I believe it's still helpful to anticipate potential reversal areas if we truly are now dealing with a bear market.
Take a look at current conditions first:
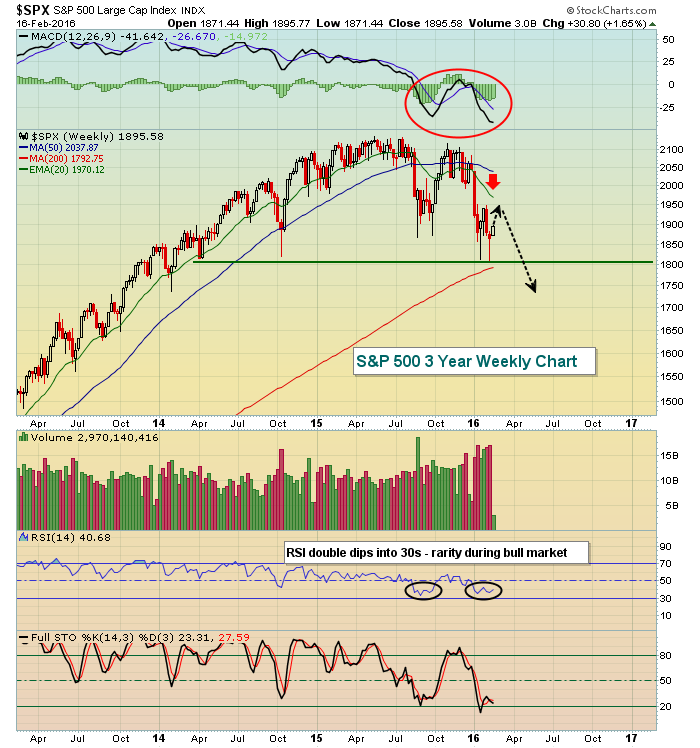 While we haven't seen the price support break yet, the chart certainly seems to be rolling over and the weekly MACD is awful, suggesting a 20 week EMA test could be the ultimate destination of the current counter trend rally. I've shown this possibility with the dotted black lines. Note that weekly RSI has twice broken beneath normal RSI 40 support during bull markets. That also shows weakening technical conditions. The bull market cannot resume with the weekly RSI remaining below 60 and the weekly MACD in negative territory so technical bulls have plenty of work ahead to rectify these weaknesses.
Compare the above to where we stood in late 2007:
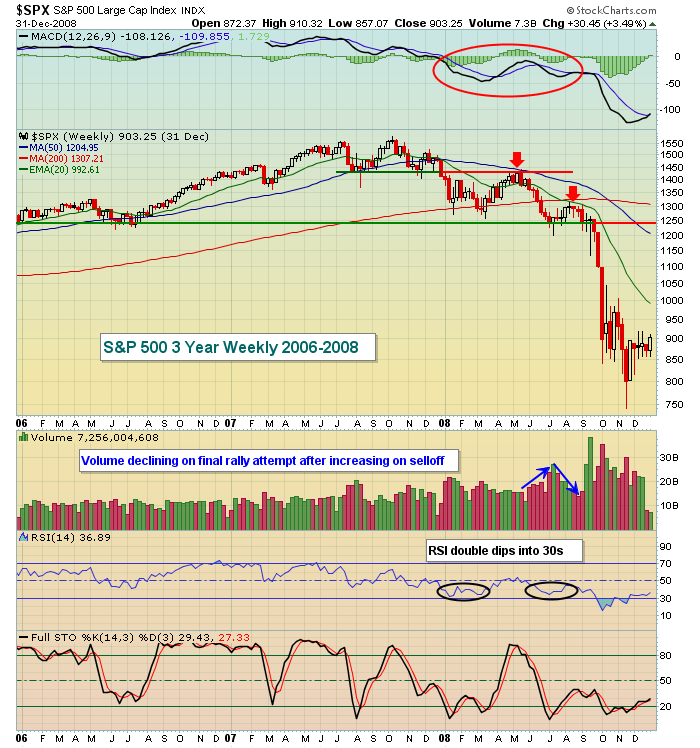 The two red arrows demonstrate to me the potential of the current rally we're experiencing if we truly have entered a bear market. The first red arrow shows the S&P 500 rallying to the area of the most recent price breakdown, or the 1440 level. The second red arrow shows a failure at the declining 20 week EMA with a weekly MACD pointing lower. Those two levels in 2016 are 1995 (recent price support that failed) and 1970 (current 20 week EMA). The last reaction high was near the 1950 level so I could see this rally extend to 1950 and hit recent price resistance and the falling 20 week EMA simultaneously. A break above this area would suggest the next level, or 1995.
There's always the possibility that this bearish scenario does not play out. In order for me to regain a more bullish posture, I'd need to see both of these resistance levels cleared with money rotating back toward aggressive areas of the market.
Sector/Industry Watch
Okay, so the market is rallying. Is it currently being supported by money rotating into "risk on" areas? Take a look at how our last rally ended:
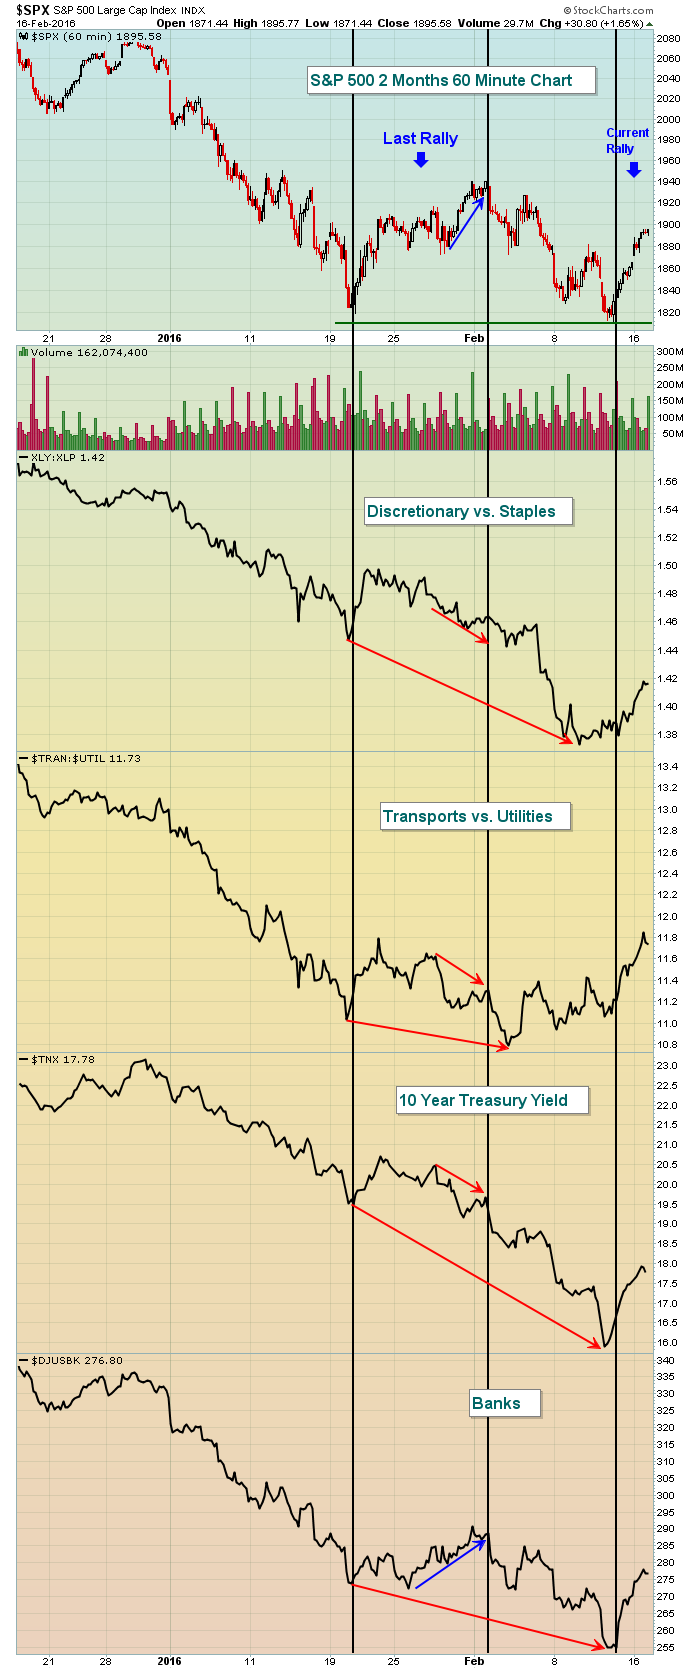 If you simply looked at the S&P 500 performance in early February, you likely would have remained bullish. But just as that rally ended at 20 day EMA resistance (not pictured above since this is an hourly chart), look at how money rotated away from risk. If market participants are not willing to take risk at key areas of resistance, neither should we. Trading is not about being right all the time, it's about managing risk! If the S&P 500 kept powering forward, then so be it. We need confirming signals to be willing to keep our capital at risk on the long side and only banks performed well at that last S&P 500 high. Discretionary stocks fell apart. Transports collapsed. And money flowed to treasuries, sending the corresponding yield much lower. Those are signs to take your money and RUN!
So as I follow the current rally, I'll be watching these signals, among others. One difference this time is that we currently show positive divergences on the daily MACDs in many places. Rather than look for reversals at 20 day EMAs as I normally would, I believe we have a "shot" to test the 50 day SMA on this rally and reset our daily MACD close to its centerline. That could coincide with a 20 WEEK EMA test. But if this rally begins to lose steam and money rotates to defense again, I'll take profits and be gone on the long side. At that point, I'll be looking to re-establish short positions for what I believe will be the next leg down.
Historical Tendencies
Since 1950, the second half of February has produced annualized returns of -9.64% on the S&P 500. So in addition to technical headwinds in the weeks ahead, the bulls will need to stave off historical bearish behavior to close out February as well.
Key Earnings Reports
(actual vs. estimate):
ADI: .56 vs .53
DPS: 1.00 vs .98
GRMN: .74 vs .47
PCLN: 1.16 vs 10.90
TMUS: .34 vs .12
(reports after close, estimate provided):
ABX: .07
CF: .86
MAR: .76
NEM: .14
NTAP: .52
NVDA: .32
Key Economic Reports
January housing starts released at 8:30am EST: 1,099,000 (actual) vs. 1,175,000 (estimate)
January building permits released at 8:30am EST: 1,202,000 (actual) vs. 1,224,000 (estimate)
January PPI released at 8:30am EST: +0.1% (actual) vs. -0.2% (estimate)
January Core PPI released at 8:30am EST: +0.4% (actual) vs. +0.1% (estimate)
January industrial production to be released at 9:15am EST: +0.4% (estimate)
January capacity utilization to be released at 9:15am EST: 76.7% (estimate)
FOMC minutes to be released at 2:00pm EST
Happy trading!
Tom


