Market Recap for February 19, 2016
The U.S. market was mixed on Friday with the more aggressive Russell 2000 and NASDAQ leading the action with gains of 0.53% and 0.38%, respectively, while the S&P 500 was flat and the Dow Jones was down fractionally at 0.13%. The good news was that equities were rising into the final hour and during an up leg, that's generally a bullish sign. We're seeing that effect this morning on U.S. futures. More on that below in the Pre-Market Action section.
Consumer discretionary (XLY) and technology (XLK) have been the two biggest winners in terms of sector performance over the past week, rising 4.23% and 3.54%, respectively. Two defensive groups, consumer staples (XLP) and utilities (XLU) have been the two worst performing as they've climbed just 1.54% and 1.40%, respectively, over the same one week period. This relative strength in aggressive sectors bodes well for the short-term. In fact, given recent positive divergences on daily MACDs and until key resistance levels are tested, the bulls are in charge.
All is not clear, however, as this rally still appears to me to be nothing more than a counter trend rally where longs should be reduced and shorts increased. In technology, for instance, the best performing industry group in 2015 was internet stocks ($DJUSNS). On this rally, the DJUSNS has only outperformed one other technology group - mobile telecommunications ($DJUSWC) - and reclaiming its key level at 1025 has been difficult. Take a look:
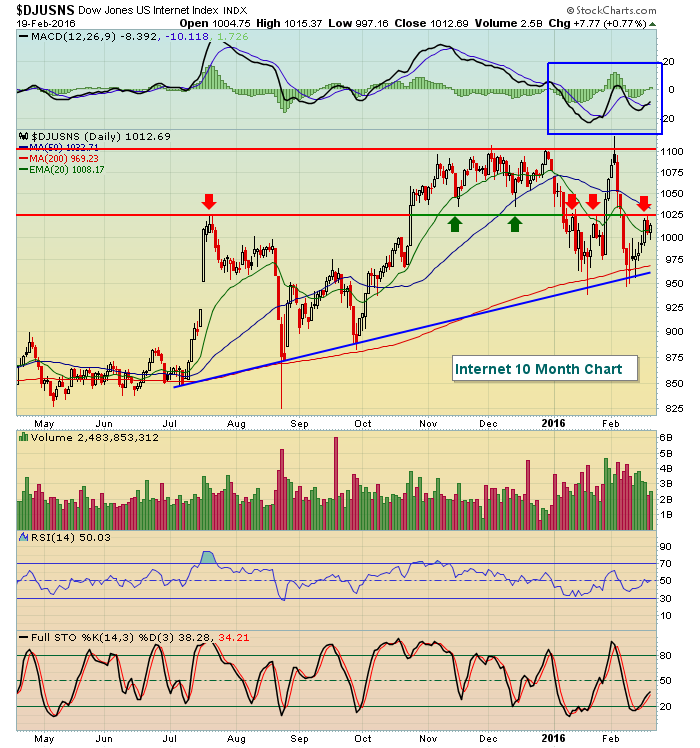 The MACD remains in negative territory suggesting that the momentum still resides with the bears. Additionally, the 1025 level has been a pivot area for the DJUSNS for months. Its rise has been slower than many other areas within technology so negotiating 1025 will be important - on a closing basis. I'd be careful with a false breakout followed by a weak finish. You can argue where trendline support is based on which lows on the chart you connect, but it's likely somewhere in the 950-975 area. A break above 1025 would be bullish and could lead to internet stocks leading a further NASDAQ rally. Failure to do so, however, increases the odds of a retest of the trendline from 950-975 - and that would likely lead the NASDAQ to a retest of recent lows.
Pre-Market Action
Signs are positive this morning and we could still be feeling the effects of options expiration from last week. I could point to market makers' desires to see prices rise to offset much put option premium as one reason for this rally. And it could be having a lingering effect as the market opens. Keep in mind, however, that this time of the calendar month typically belongs to the bears so don't be shocked by an intraday reversal. We'll need to watch to see whether money continues to rotate towards aggression. There was slight trepidation in this regard the latter half of last week as can be seen from the chart below:
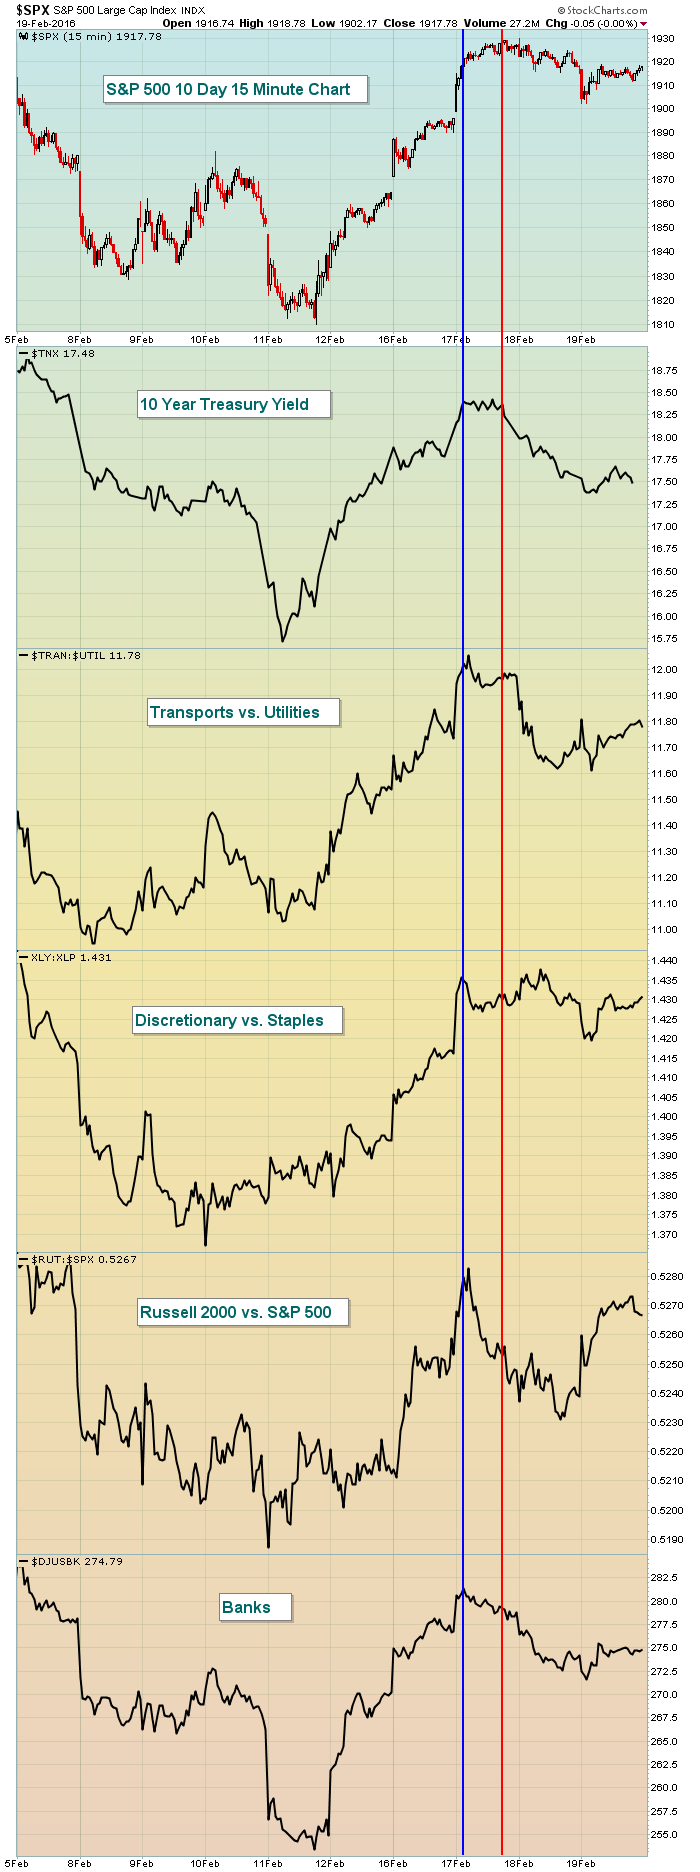 This may be a form of hair-splitting, but take a look at where the S&P 500 set its high on Wednesday (red vertical line). Note that many of the relative ratios that I follow topped several hours prior (blue vertical line). This action isn't horrible by any means, but it bears watching today and throughout this week. Should the S&P 500 continue pushing higher without the support of aggressive sectors and at key price and moving average resistance, the odds of a continuing rally would diminish. Be careful.
Action in Asian markets overnight was quite positive and European markets are higher to the tune of more than 1%. So there'll be global market tailwinds helping the U.S. as a new trading day and week get started.
The 10 year treasury yield ($TNX) is nudging higher this morning, up 2 basis points to 1.77% at last check. One indication of the likelihood of a continuing S&P 500 advance would be the TNX closing back above its 20 day EMA, currently at 1.84% - also the recent reaction high in the TNX. A rising yield means treasuries are selling and that can provide the proceeds necessary to support a rising equity market.
Current Outlook
Evaluating the strength of this rally will be critical to trading decisions. The positive divergences across the board suggested this rally would be longer than previous rallies and I wrote about that ten days ago with my article "Why This Rally Could Last A Bit Longer". I'm not at all surprised by the duration of this rally, nor the percentage gain. In fact, there is certainly more room ahead for stocks to rally. When I see positive divergences, I look for prices to rise to test falling 50 period SMAs and to reset the MACD at its centerline resistance. So on the S&P 500, for instance, here's the expectation based on this indication alone:
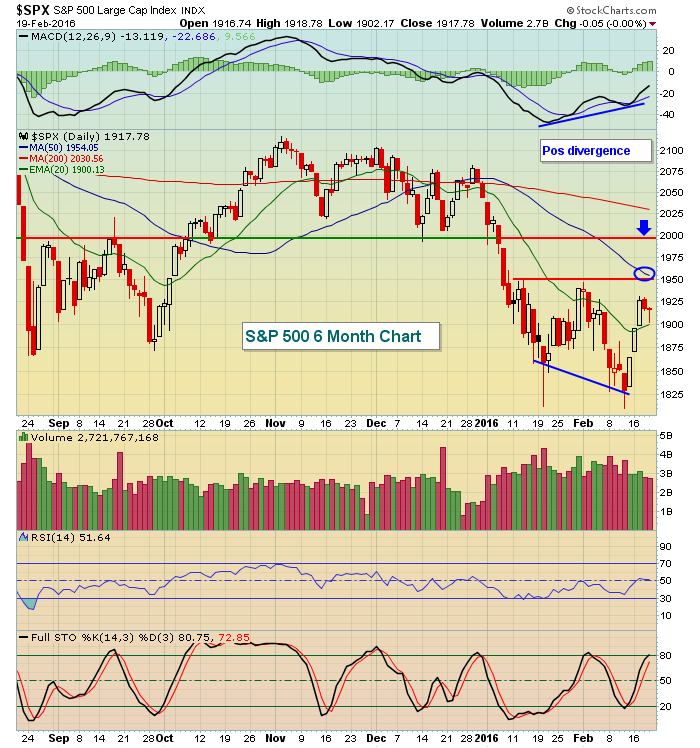 If futures remain strong, we could approach that first test at 1950 today. Recent reaction highs have failed there and the declining 50 day SMA (blue circle) is at 1954. Should the S&P 500 close above the 50 day SMA, the blue arrow at 1995 marks very significant price resistance in my view. Those who are considering shorting this rally should be excited by a test of these two levels. A closing stop could be considered at 2000 or possibly trendline resistance closer to 2040, depending on how much room you're willing to provide.
Sector/Industry Watch
The Dow Jones U.S Toys Index ($DJUSTY) had been one of the best performing industry groups in 2015. Like internet stocks above, though, their recent rally hasn't been anything to write home about. They were the best performing industry group within the consumer discretionary space on Friday, but have a few technical question marks to erase today as the day begins. Here's the current outlook:
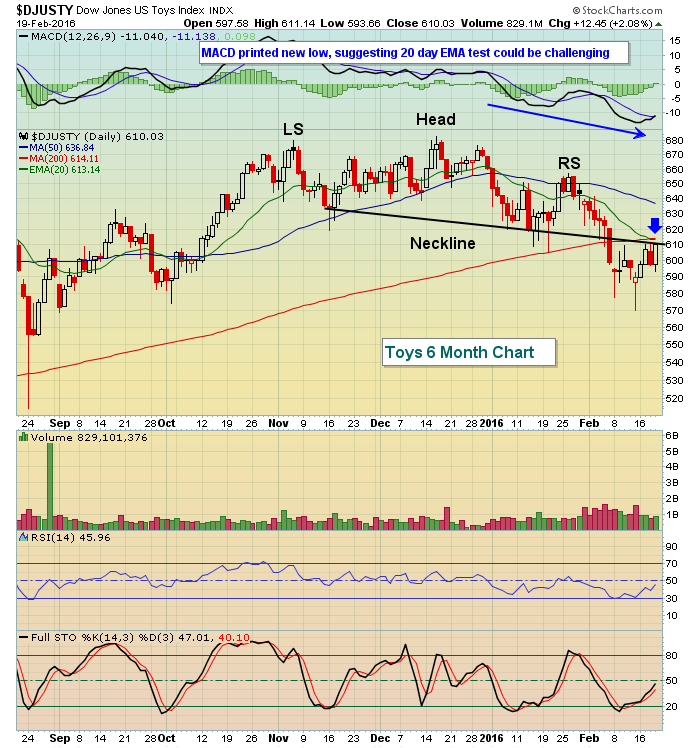 The head & shoulders breakdown is a topping pattern. It's not unusual to retest the breakdown level and the DJUSTY has done that. Also, with a weakening daily MACD, the 20 day EMA becomes a key resistance area to watch and you can see that price has risen to approach that key moving average.
Historical Tendencies
While February actually ranks as the 8th best performing calendar month on the NASDAQ since 1971, it's had an amazing run this decade with annualized returns of +50.70%, ranking 1st. This is the final week of February and the NASDAQ is currently down more than 2% this month so it has some work to do to right the ship and keep its 2010-2016 leadership role intact.
Key Earnings Reports
(actual vs. estimate):
AGN: 3.41 vs 3.37
DDS: 2.55 (estimate - haven't seen reported results yet)
VRX: 2.59 (estimate - haven't seen reported results yet)
(reports after close, estimate provided):
FIT: .20
TXRH: .30
Key Economic Reports
February PMI manufacturing to be released at 9:45am EST: 52.5 (estimate)
Happy trading!
Tom


