Special Note
I'll be joining John Hopkins of EarningsBeats.com just after the market closes today for a lively discussion of analyzing both long and short candidates during a tumultuous trading period like the one we're experiencing now. It's FREE and will be held just after the market closes today at 4:30pm EST. CLICK HERE in order to pre-register and save a spot. Hope to see you there!
Market Recap for February 23, 2016
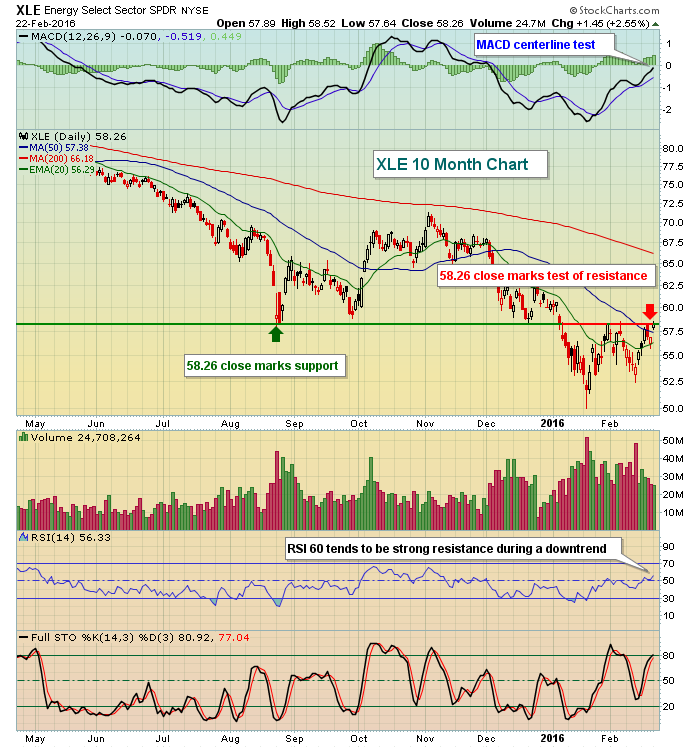
Energy (XLE) again led the rally in U.S. equities on Monday as the XLE literally closed on price resistance - exactly to the penny at 58.26. That was the pre-2016 low close back on August 25th and served as price support until the stock market's form of bloodletting began in earnest in early January. That prior support became resistance and Monday's close tested it. Obviously, today's action in the XLE will be critically important in the near-term. Here's the chart on the XLE:
 Sector performance was fairly strong on Monday, with most of the aggressive sectors performing well. Consumer discretionary (XLY) rose 1.94% with industrials (XLI) and financials (XLF) up 1.70% and 1.57%, respectively. Banks ($DJUSBK) were higher by 2.00%, enabling that beleaguered industry group to finish above its 20 day EMA for the first time in 2016. That breakthrough comes on the heels of a positive divergence, potentially setting up a further climb to the 50 day SMA. Volume, however, was very suspicious so be careful if the 20 day EMA is lost again and momentum accelerates again to the downside.
The defensive groups - utilities (XLU) and consumer staples (XLP) - both struggled on a relative basis, which is fine during a rally. In fact, it's preferable.
Pre-Market Action
One enabling factor in the recent market strength has been the declining Volatility Index ($VIX). The VIX has now fallen from its recent peak of 30.90 down to Monday's low of 19.02. That's approaching a 40% reduction in expected volatility during the recent market rally. Throughout previous bear markets, ANY reading on the VIX below 20 has proven to be solid short entry points with bottoms in the VIX typically in the 17-20 range during countertrend rallies. Here is the recent action in the VIX:
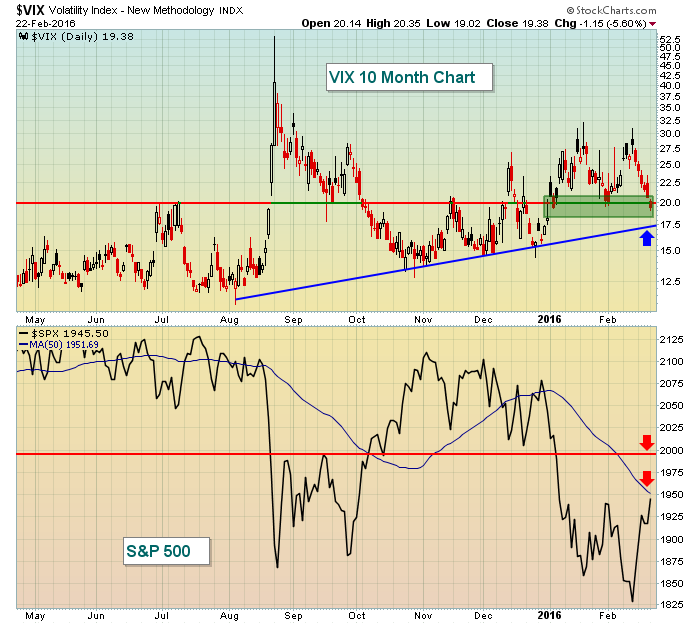 For the VIX, 20 has been a key pivot area recently so I've marked that on the chart above. There's also gap support highlighted with the green shadow. Finally, an uptrend is in place that intersects with the key 17.50 support level that we generally see in bear markets. I'm showing the VIX in the pre-market section of this report because volatility here in the U.S. has been heavily influenced by global developments. Even Fed Chair Yellen suggests the Fed is watching overseas developments. The turning point in this rally could be accompanied by a reversing candle on the VIX. That's why I wanted to highlight the key areas of support on the chart above.
In terms of pre-market action, U.S. futures are lower and weakening over the past 30-45 minutes or so. Asian markets were all lower overnight, albeit fractionally. The action in Europe this morning has been mostly lower so it'll be up to the U.S. to turn the tables this morning.
Home Depot (HD) and Macy's (M) both reported quarterly results that are being cheered by traders in pre-market action, while Fitbit (FIT) is down nearly 14% this morning after lowering guidance.
There'll be a couple of housing reports out later this morning that should be watched. The Case Shiller HPI will be out at 9am EST and existing home sales an hour later. The Dow Jones U.S. Home Construction Index ($DJUSHB) closed above its 20 day EMA yesterday for the first time in 2016 with a positive divergence under its action. Decent news out of housing today could see that group lead given the current technical outlook. However, we are in what I believe is a confirmed downtrend so failure to hold its 20 day EMA should be viewed as a warning sign of further losses ahead.
Current Outlook
Nothing is more important, in my view, than the combination of price and volume. Yes, underlying action needs to be reviewed but it's difficult to ignore high volume breakouts and breakdowns. Yesterday's advance in the S&P 500 neared its first significant price resistance test and it did so on the second lowest daily volume of 2016. January 5th (prior to the January 6th price breakdown) was the only trading day this year to show less volume on a trading session. Take a look at the price resistance on a shorter-term six month chart:
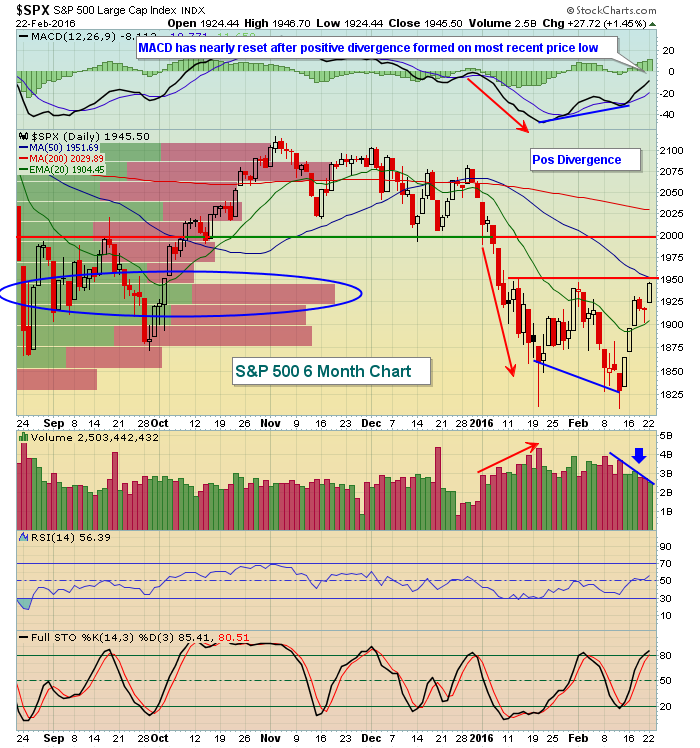 There's a lot going on in this chart, but let's review a few things. First, the price breakdown in early January was accompanied by increasing volume throughout the downtrend. The most recent recovery to price resistance has been accompanied by relatively light volume (blue arrow) and no key price breakouts have yet been achieved. Next, the left side of this chart shows "volume by price" bars that you'll find under "overlays" in the chart settings. (Remember, you can always click on this chart to get a live chart and to see the chart settings). Note that over the past six months, there's been more volume in the 1925-1950 range than any other range. So in addition to the price resistance that we can see from the red horizontal line at 1950, the volume by price bar also highlights this area of resistance. The good news for the bulls is that the volume by price bar from 1950-1975 shows little resistance. Therefore, a break above 1950 (which also would clear 50 day SMA resistance) would likely send the S&P 500 surging to test a significant price resistance level at 1995. I don't know if this rally carries us to 1995, but if it does, look for a major battle to take place there.
Sector/Industry Watch
The recent market rally has been supported by a strengthening XLY:XLP ratio. A rising ratio here helps to sustain a rally as it indicates that money is flowing to the more aggressive consumer names. Those names outperform during a period of economic strength or during periods where market participants anticipate improving economic conditions. We simply have to realize that this is just one indicator and that it's bouncing after a horrendous last few months. Here's the current state of this ratio:
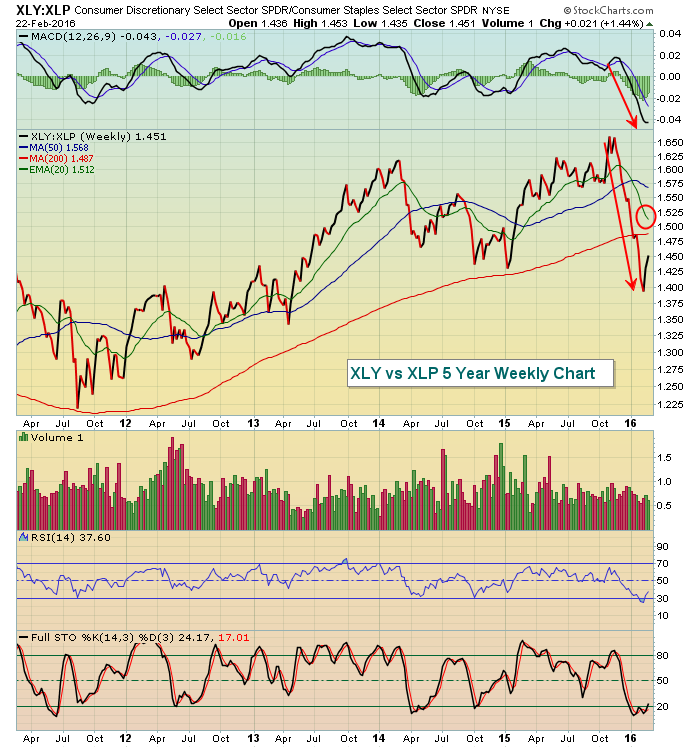 The relative strength of the XLY vs. the XLP tumbled beginning in November and at the bottom its RSI was below 30 and stochastic was below 20. That's the most oversold we've seen this ratio in the past five years and is indicative of the flight to safety we've witnessed over the past few months. Nearly every ratio that evaluates the risk mentality of market participants shows the same thing - that participants want little to do with risk. Personally, I believe this bounce in U.S. equities is temporary and that the swing to more aggressive investments is temporary as well. The red circle above highlights the declining 20 day EMA. I'd look for this ratio to stall at that moving average, if it gets there.
Historical Tendencies
Looking ahead, March has produced positive action 43 of the last 65 years on the S&P 500. The strength is felt across all indices, but the March annualized returns on the S&P 500 since 1971 have been 13.98% while just 9.70% on the more aggressive NASDAQ. So the recent tendency for traders to seek out safety has applied for years during the month of March. Given the uncertainty that global markets currently face, I'd look for this S&P 500 relative strength in March to continue.
Key Earnings Reports
(actual vs. estimate):
BMO: 1.75 vs 1.72 (CC)
HD: 1.17 vs 1.10
LAMR: 1.27 vs 1.17
LXK: 1.16 vs 1.18
M: 2.09 vs 1.86
ODP: .07 vs .11
SJM: 1.76 vs 1.62
TOL: .40 vs .41
(reports after close, estimate provided):
FSLR: .80
VRSK: .75
Key Economic Reports
December Case-Shiller HPI to be released at 9:00am EST: +0.8% (estimate)
February consumer confidence to be released at 10:00am EST: 97.2 (estimate)
January existing home sales to be released at 10:00am EST: 5,320,000 (estimate)
Happy trading!
Tom


