Market Recap for Wednesday, February 3, 2016
This morning's article will be brief as I'll be traveling today.
Energy (XLE) and materials (XLB) rose 3.56% and 3.36%, respectively, to lead a rally from key price support on Wednesday. A more than 1.5% drop in the U.S. dollar ($USD) triggered a solid portion of those commodity gains. Here's a look at the USD on a longer-term weekly chart:
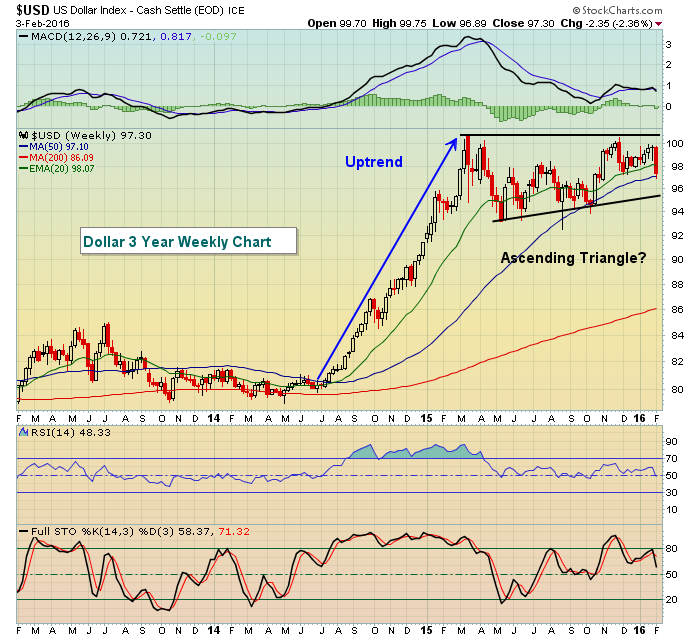 While the dollar's weakness is playing a short-term role in renewed strength in both the XLE and XLB, the longer-term pattern on the dollar still appears strong to me. Loss of the rising 20 week EMA was not a positive but the overall pattern still suggests a continuation of the prior uptrend. I'll be keeping a close eye on the dollar.
Pre-Market Action
It's still a few hours before the stock market opens in the U.S., but futures are currently higher. They've retreated some overnight, but at least for now appear as if they're on track to continue the rally we saw yesterday afternoon.
Current Outlook
The longer-term outlook has turned more bearish, but price support does continue to hold with yesterday's reversal off earlier lows a solid sign near-term. But there will be tests ahead on any further strength. Here's an intraday outlook on the S&P 500:
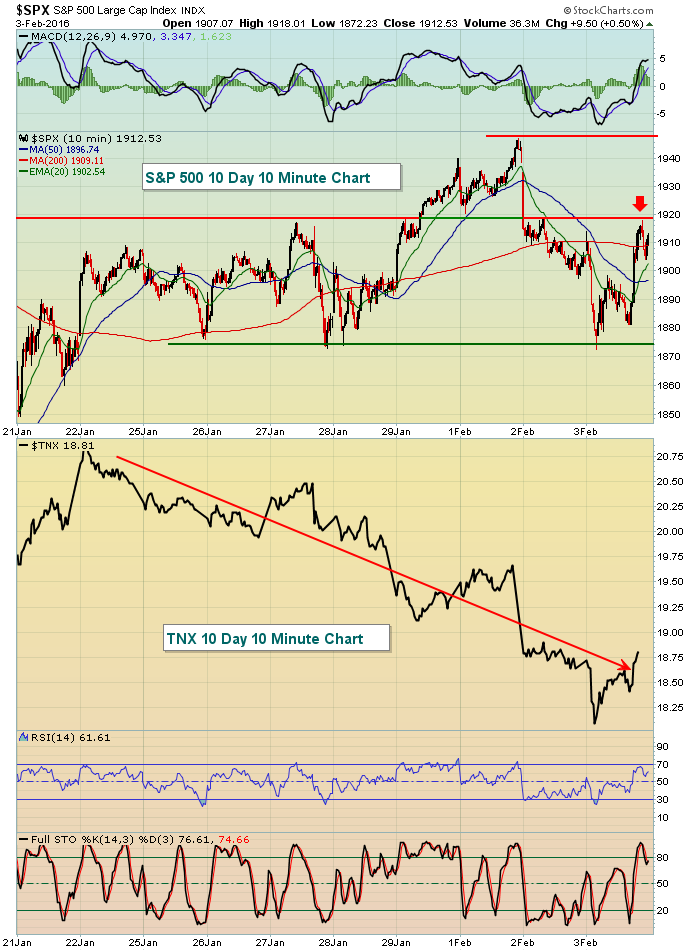 In the near-term, the S&P 500 is in a trading range from 1875 to 1920 (red arrow). A break above 1920 could lead to further strength and a test of recent highs close to 1950. One problem for the market is that money continues to flow toward treasuries with the 10 year treasury yield ($TNX) plummeting. That is a problem as every dollar moving into treasuries is a dollar not moving into stocks. The S&P 500 bulls would get a lift from a TNX that surges higher so look for that as confirmation of an extended short-term equity rally.
Sector/Industry Watch
Defense ($DJUSDN) has remained a very strong area of the U.S. stock market. Below is a five year weekly chart that shows its uptrend remains intact and its weekly MACD has continued to print above zero despite a very difficult market. Take a look:
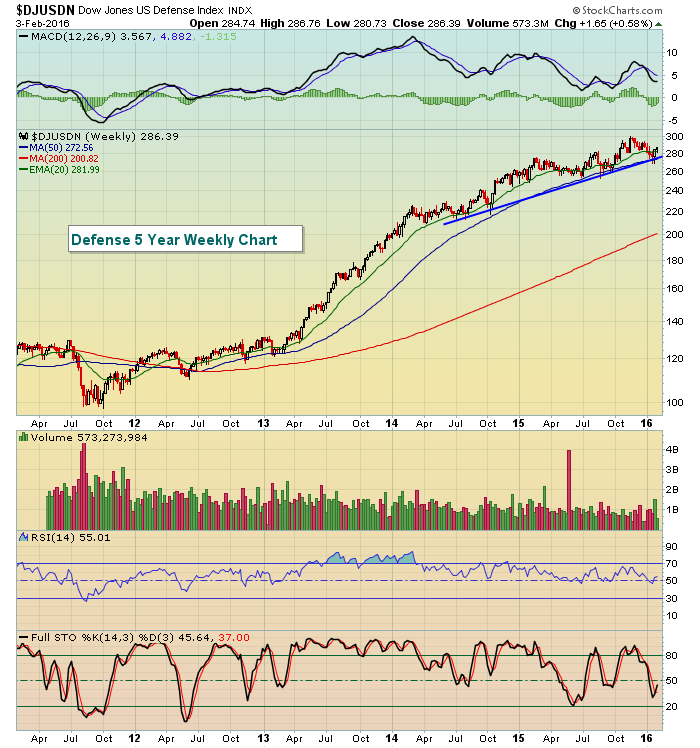 If the trendline breaks with heavy volume, I'd be more cautious. Until then, the DJUSDN appears to be one of the best areas for trading on the long side.
Historical Tendencies
On the NASDAQ, Wednesdays are the best performing day of the week since 1971, followed by Fridays, Thursdays, Tuesdays and......Mondays. Over a 45 year stretch, Mondays have produced annualized returns of more than -17%. Talk about the Monday blues!
Key Earnings Reports
(marked as "b" before or "a" after today's close, estimate provided):
ATHN (a): .16
AZN (b): .88
BRCM (a): .72
CI (b): 1.78
CLX (b): 1.05
CMI (b): 2.13
COP (b): (.64)
DECK (a): 4.72
DNKN (b): .50
ICE (b): 3.01
LNKD (a): .00
MTD (a): 4.61
OXY (b): (.14)
PM (b): .81
RL (b): 2.11
SKYW (a): .44
SYMC (a): .18
VMC (b): .62
Key Economic Reports
Initial jobless claims to be released at 8:30am EST: 280,000 (estimate)
Q4 productivity to be released at 8:30am EST: -1.8% (estimate)
December factory orders to be released at 10:00am EST: -2.8% (estimate)
Happy trading!
Tom


