Note: I am returning at noon EST today for my "Trading Places LIVE" webinar. I'll be discussing several timely topics including the January Effect and the key technical failures that took place on Tuesday across many of our major sectors and industry groups. The webinar is FREE and you can REGISTER HERE. Next, I write this daily blog every day the U.S. stock market is open. To make it easy for you, you can subscribe to this blog and receive my latest article at the moment it's published. At the bottom of this article, there's a question that asks "Would you like to receive e-mail notifications whenever a new article is added to this blog?". Click the "Yes" button, type in your e-mail address and hit "Subscribe". Voila! My next article will be sent to you as soon as it's published. It's a really cool feature here at StockCharts.com and can be used with any of your favorite blogs so please take advantage of it.
Market Recap for Tuesday, February 2, 2016
Well, the selling kicked back in and it wasn't pretty. The volatility index ($VIX) rose 10%, spiking off of a pivotal level near 20 as reflected below:
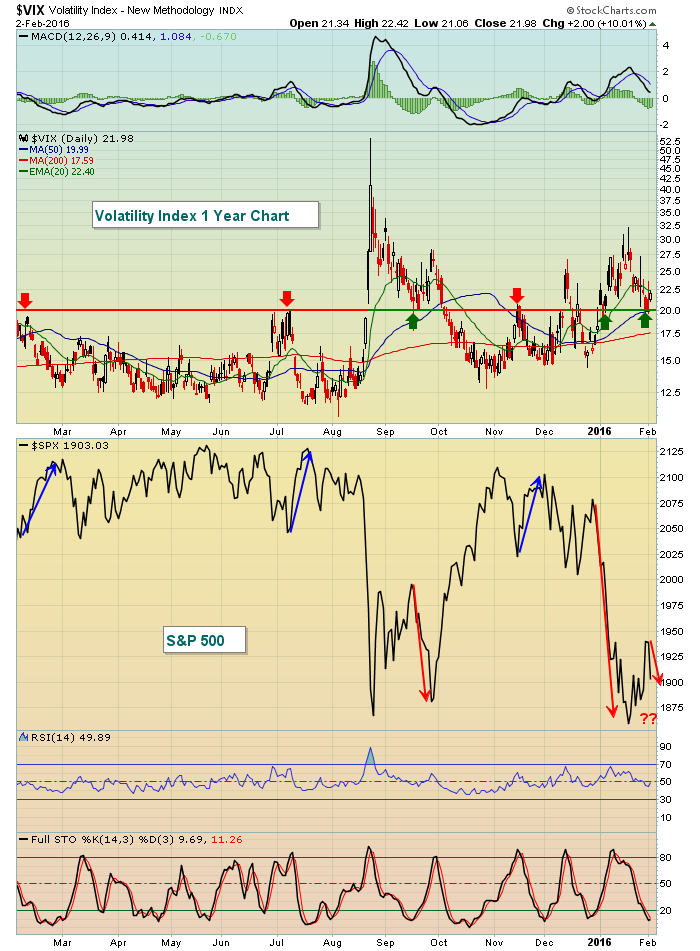 The red arrows mark tops in the VIX during a bull market. Each time the VIX hit or approached 20, the S&P 500 rallied. The October and November market behavior was confusing as the VIX lost 20 support after having sailed through it. Since November, however, the below the surface action in the market has turned very bearish with the latest stock market selloff confirming the beginning of a bear market in my view. Therefore, I'm not surprised that the VIX hit 20 on Monday and then the S&P 500 immediately had another bout of impulsive selling on Tuesday.
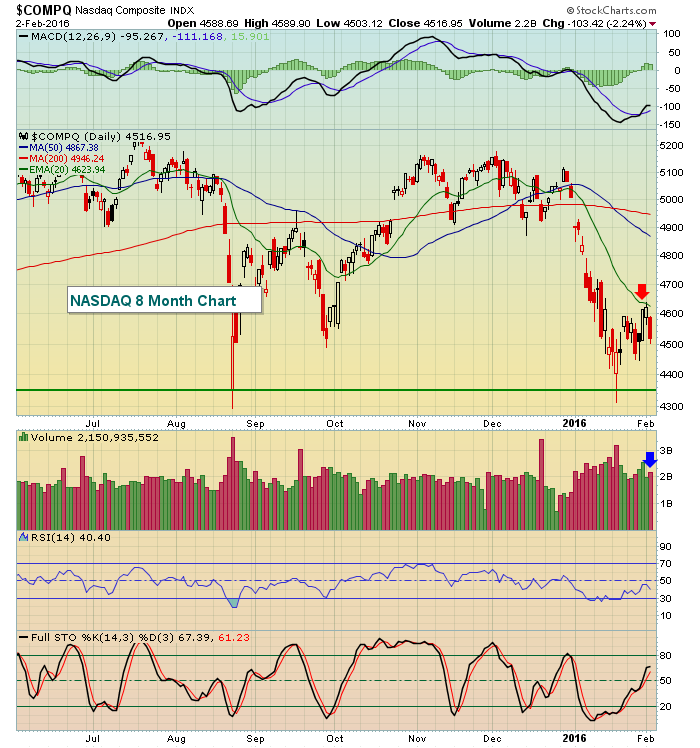
Also confirming bear market action was the failure of both the NASDAQ and Russell 2000 at their respective declining 20 day EMAs. Check it out:
NASDAQ:
 Russell 2000:
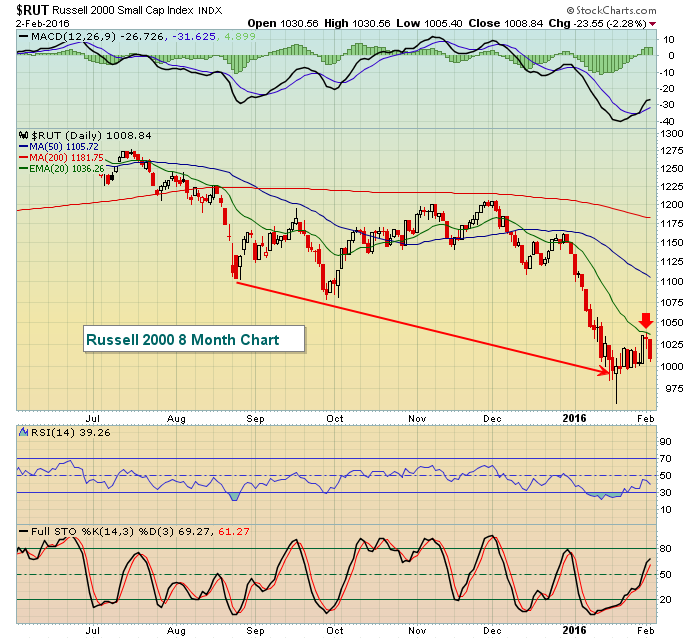 Note on the NASDAQ chart that volume picked up on Tuesday from Monday's level just as the selling resumed. That's not a great sign. And the red arrows on both charts highlight the successful bearish tests of the declining 20 day EMAs.
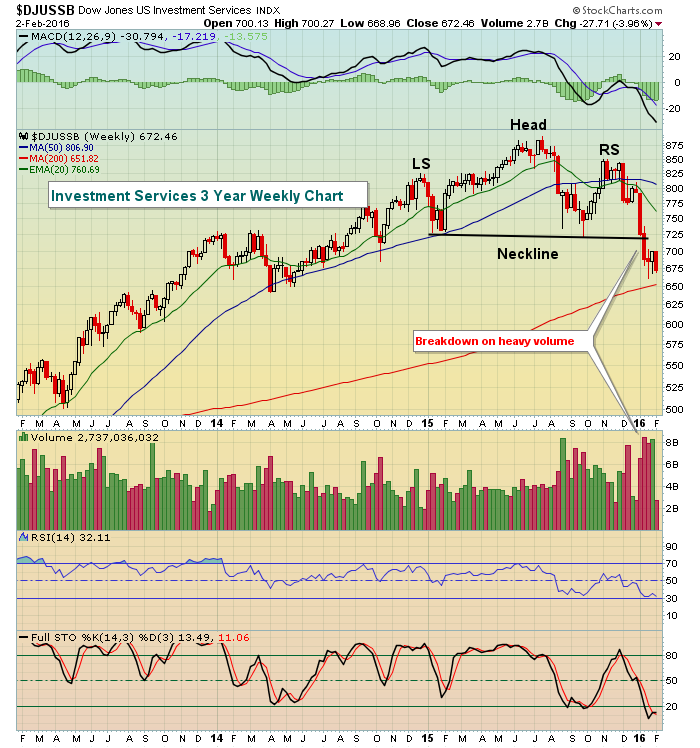
Energy (XLE) and financials (XLF) led the market to the downside on Tuesday as crude oil prices ($WTIC) gave back another 5% and closed beneath $30 per barrel. Investment services ($DJUSSB) were a very weak part of the financial sector on Tuesday, evidenced by their recent head & shoulders breakdown that's featured in the Sector/Industry Watch section below.
Pre-Market Action
U.S. futures are modestly higher in response to the big Tuesday selloff and slightly better-than-expected jobs numbers from ADP. The jobs beat this morning has created a bit of selling in treasuries with the 10 year treasury yield ($TNX) rising slightly to 1.88% at last check. There was a huge technical breakdown in the TNX beneath key yield support at 1.90% on Tuesday so if equities are looking to rise today, they'll need some help from treasuries in the form of a rising TNX.
Europe is trading mostly lower this morning, offsetting a bit of a positive bias here in the U.S.
Current Outlook
All signs continue pointing to a bear market that's underway. The bulls still cling to price support on the S&P 500 that was established at the October 2014 low. The recent intraday low of 1812 actually cleared the intraday low from October 2014, but this same general price support zone has been holding on a closing basis. Loss of price support would be the final straw as we've been witnessing deteriorating conditions in terms of rotation for months now.
Areas of the market that have been crushed in recent weeks/months may hold up better during future weakness as the remainder of the market plays catch up. We're seeing some of the "chosen few" beginning to flash signs of technical weakness, stocks like Netflix (NFLX) and Amazon.com (AMZN). Even Alphabet's (GOOGL) powerful quarterly results after the closing bell on Monday went largely unnoticed by the closing bell on Tuesday. GOOGL reached an intraday high of 810.35 before selling off to close at 780.91, squarely on its low of the session. The problem technically is that GOOGL's failed breakout attempt comes with a nasty negative divergence on its weekly MACD. I posted this yesterday, but have another look:
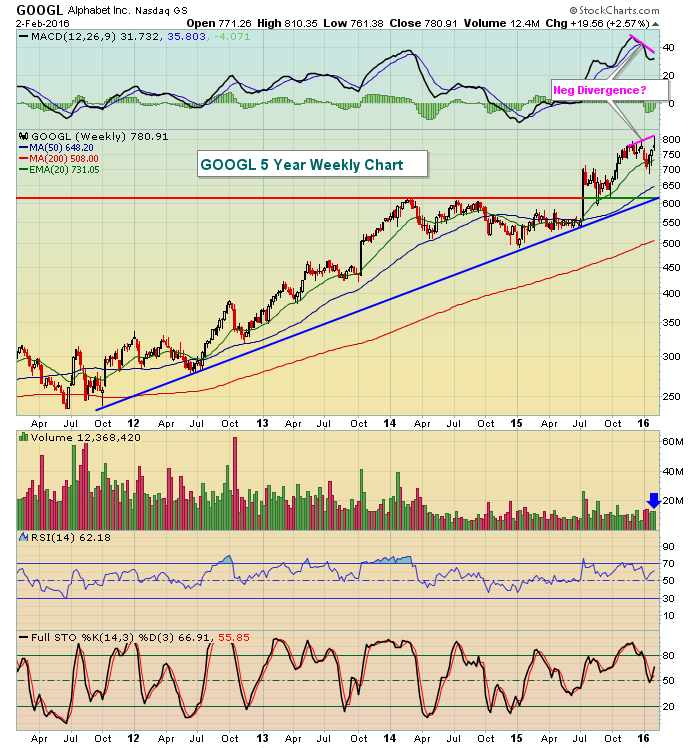 The volume, while only 12.4 million, is only through Tuesday. Keep in mind this is a weekly chart so volume will be very heavy by Friday's close. The negative divergence labeled really isn't technically a negative divergence. Hence, the question mark. A negative divergence requires a lower MACD to accompany a higher CLOSE. Since this weekly chart doesn't CLOSE until Friday's session has ended, there's no negative divergence by definition. It would be the equivalent of burying your head in the sand, however, to ignore the failed breakout attempt on heavy volume in a market that is turning more and more bearish every day.
The long-term weekly chart on GOOGL shows a powerful uptrend and I remain very bullish the stock longer-term. But the trendline and rising 50 week SMA both suggest that selling for a period of time could take the stock down to test this 600-650 range while it remains in its long-term uptrend. This is not a stock that I would short because it's a leader, but I'm not sure I'd hold it on the long side either. Current stock market action suggests extreme caution, particularly on the long side.
Sector/Industry Watch
Don't expect much strength in investment services ($DJUSSB) for awhile. There's been a bearish technical development in the group in 2016 as they broke below neckline support in a topping head & shoulders pattern. Check it out:
 Goldman Sachs (GS) is a major player in the group and has broken down out of a very similar pattern.
Historical Tendencies
Since 1971, the NASDAQ has risen during the month of February 25 times while falling 20. The average annualized return during the month of February is +8.34%, which places February in 8th place among the 12 calendar months. The months that run from July through October are the four months that perform worse, on average, than February.
Key Earnings Reports
(actual vs. estimate):
ADP: .72 vs .71
ALXN: .84 vs .88
ETN: 1.17 vs 1.09
GM: 1.39 vs 1.23
IP: .87 vs .83
MPC: .79 vs .67
MRK: .93 vs .91
SO: .44 vs .42
(reports after close, estimate provided):
AVB: 1.96
BWLD: 1.47
BXP: 1.28
GPRO: (.07)
MCHP: .55
MET: 1.36
SU: .13
YUM: .66
Key Economic Reports
January ADP employment report released at 8:15am EST: 205,000 (actual) vs. 190,000 (estimate)
Happy trading!
Tom


