Market Recap for Wednesday, February 17, 2016
Energy stocks (XLE) soared yesterday, rising 3.28% to easily lead all sectors. Eight of the nine sectors finished higher with only utilities (XLU) coming up short. Leading energy has been the resurgence of coal stocks ($DJUSCL) as the DJUSCL is setting up in a bottoming reverse head & shoulders pattern. Both the XLE and the DJUSCL are nearing key breakouts as shown on the two charts below:
XLE:
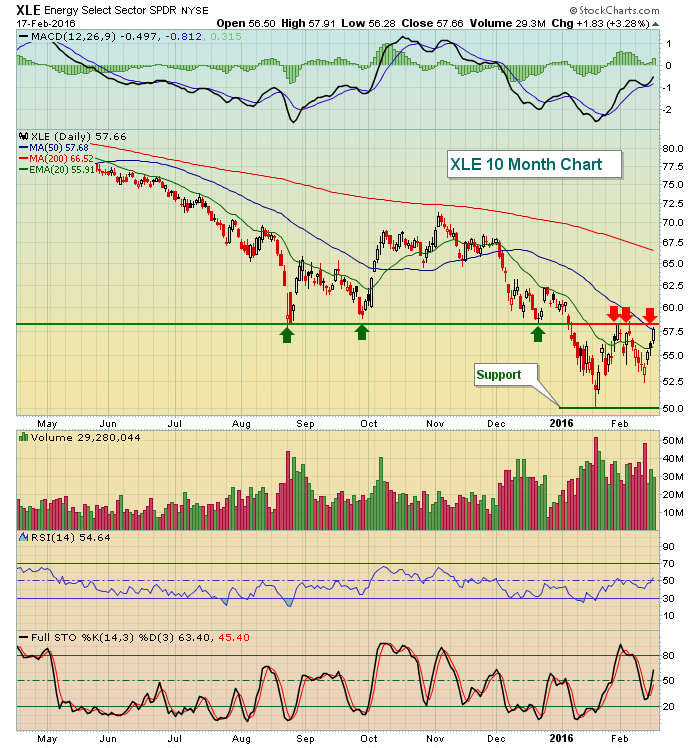 Recently, I described XLE's trading range as 50.00-58.00. Wednesday's close of 57.66 puts the XLE on the cusp of a breakout in a market that sorely needs leadership from something other than utilities. One key to a potential XLE breakout will be whether the DJUSCL can clear neckline resistance as illustrated below:
DJUSCL:
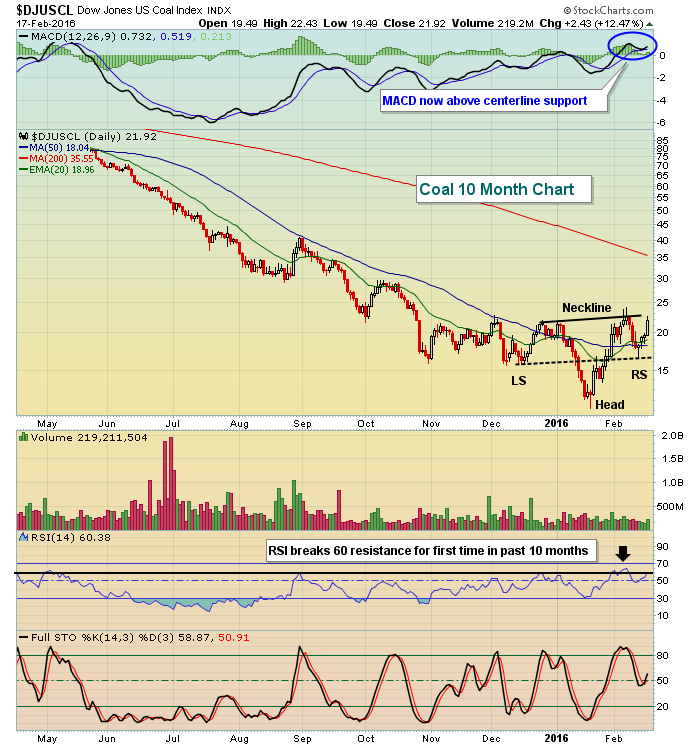 The neckline and shoulders are both upsloping, which I find more preferable (just as I prefer downsloping neckline and shoulders in a topping head & shoulders pattern) in a bullish bottoming pattern. The reason is fairly simple. It shows the bulls were able to muster up enough strength to clear the highs on the left side of the neckline, clearing price resistance - even if only for a day. Also, if an upsloping neckline is cleared on a closing basis, then by default price resistance will be cleared as well. The upsloping shoulders provide a similar signal - that bearish action wasn't as strong during the printing of the right shoulder as it was during the printing of the left shoulder.
Pre-Market Action
Global markets have been participating in the rally. All of the primary European indices have moved back above their respective 20 day EMAs and most are looking to extend gains this morning, particularly the German DAX ($DAX), which is higher by another 1.46% at last check. The DAX closed on Wednesday 14 points above its 20 day EMA and it's challenging key price resistance as highlighted below:
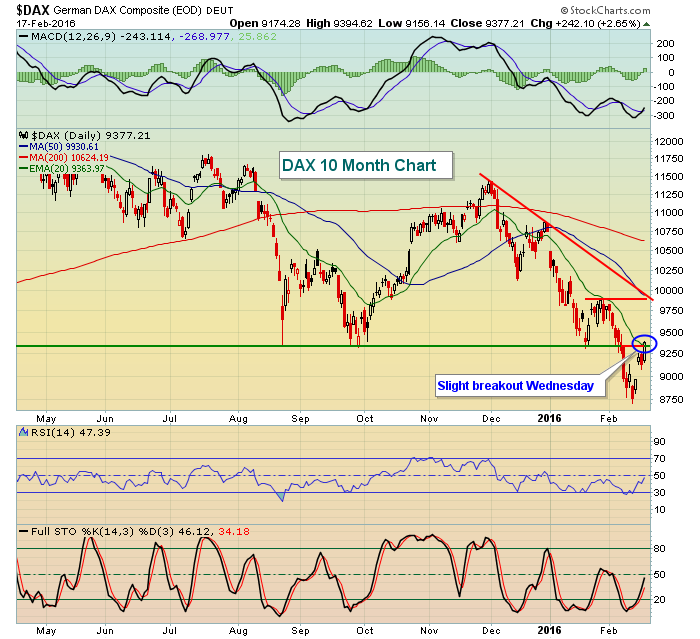 The DAX is set up for more strength and there's a strong positive correlation between DAX performance and S&P 500 performance so we can take further clues here in the U.S. from developments in Germany. At least for this morning, we remain full speed ahead.
Overnight, Asian markets were mixed with nice gains in Tokyo ($NIKK) and Hong Kong ($HSI) while China's Shanghai Composite ($SSEC) fell fractionally.
Jobless claims were reported below consensus estimates and the Philadelphia Fed Survey essentially matched expectations. Look for volumes on our major indices to expand today and tomorrow as options expiration Friday nears. Whipsaw action could accelerate too, especially as the Volatility Index ($VIX) nears support closer to 20.
Current Outlook
Sector and industry group action continues to support near-term strength. But if you look at the longer-term picture with a bearish slant, as I do currently, then it's important to note that short-term strength is weakening the reward to risk scenario for long positions. We also must keep in mind that it's options expiration week and there were a TON of net in-the-money puts. That suggests that it behooves market makers to buy stocks to raise prices, thus reducing or eliminating much of the net put premium that existed just one week ago. Once options expire, we could easily see a resumption of the prior downtrend and bearish action.
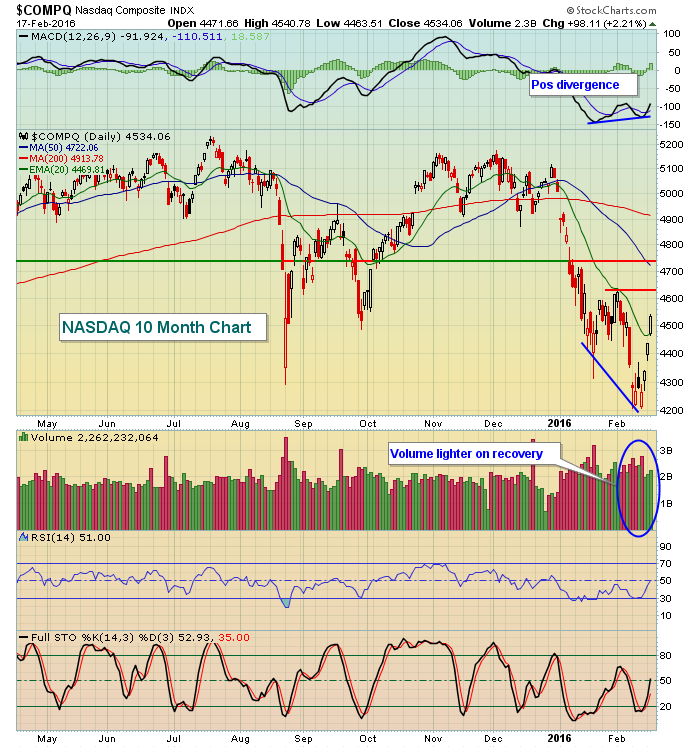
If you're on the long side, simply keep stops in place in the event the market begins to roll over again. Volume is likely to pick up as we head into options expiration Friday, but volume the past few days has been lighter during this rally. Take a look at the NASDAQ chart with two key areas of resistance provided:
 In addition to the price resistance levels above, keep two other points in mind. First, it's typical for the market to be quite strong in the afternoon during rallies. So selling in the final two hours for a couple days could signal the beginning of distribution prior to the next leg lower. Also, another hint could be the printing of negative divergences on 60 minute charts. Currently, the 60 minute MACDs are quite strong, suggesting that tests of rising 20 hour EMAs will hold. Failure to do so, however, would be a warning sign.
Sector/Industry Watch
Investment services ($DJUSSB) have been an awful industry group within financials, but they're a poster child for why this rally could last longer. The weekly chart (not shown below) remains in very poor shape so ultimately I see this group moving lower. However, there's a positive divergence on the daily MACD and the DJUSSB hasn't yet even broken above its declining 20 day EMA. Should it accomplish that technical feat, there's more upside available in the very influential financial sector. Check out the daily chart:
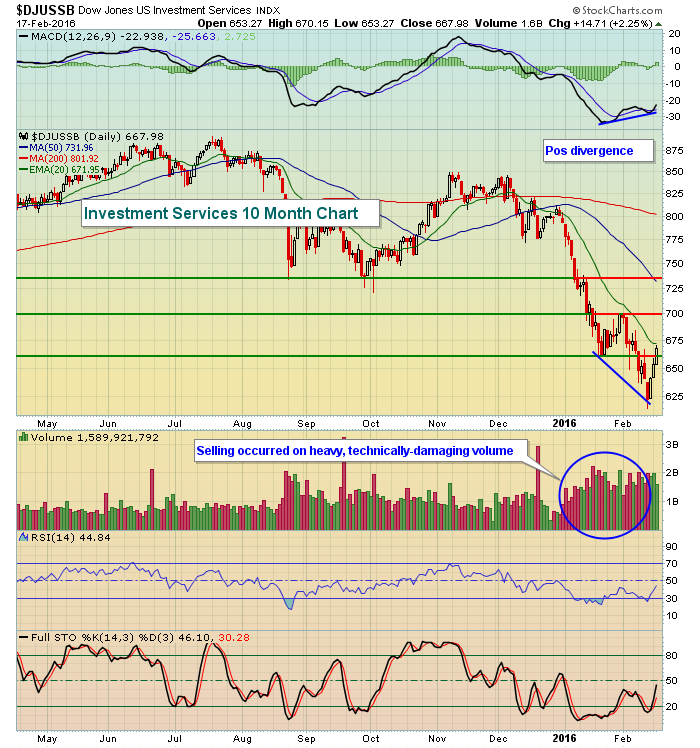 I've included the key areas of resistance. Yesterday's close cleared initial resistance near the 660 level. Next will be the late January reaction highs near 700. Finally, the 50 day SMA resides just beneath the final key resistance level at 735. A 50 day SMA test would likely reset the daily MACD back to its centerline.
Historical Tendencies
While today is mildly bullish on the NASDAQ from a historical perspective, the next few days are not. Below are the annualized returns on the NASDAQ since 1971 by calendar day:
February 18 (today): +13.08%
February 19 (Friday): -73.25%
February 22 (Monday): -26.86%
February 23 (Tuesday): -21.58%
Key Earnings Reports
(actual vs. estimates):
DISCA: .38 vs .46
DUK: .87 vs .94
MGM: .01 vs .07
WM: .71 vs .68
WMT: 1.49 vs 1.46
(reports after close, estimate provided):
AMAT: .25
ED: .55
EQIX: 3.01
JWN: 1.22
Key Economic Reports
Initial jobless claims released at 8:30am EST: 262,000 (actual) vs. 274,000 (estimate)
Philadelphia Fed Survey released at 8:30am EST: -2.8 (actual) vs. -2.5 (estimate)
January leading indicators to be released at 10:00am EST: -0.2% (estimate)
Happy trading!
Tom


