Special Note: I have joined Greg Schnell, "The Canadian Technician", in Phoenix, AZ for a few days and Greg will be hosting my Trading Places LIVE webinar both today and Monday. Greg will offer up his latest thoughts on commodities, which have been on fire, and we'll have a lively discussion about where the stock market is likely headed. The webinars are FREE and you can REGISTER HERE for today's webinar, which begins at noon EST. I hope to see you there!
Market Recap for Thursday, February 4, 2016
The U.S. dollar index ($USD) has fallen 3.18% this week and there's still one more trading day left. Potentially, we could see big swings in the dollar, treasury prices and equity prices as the latest nonfarm payrolls report is dissected by traders this morning. The dollar has been down every day this week after nearly testing the 100 level last Friday, including a .84% drop yesterday. The dollar weakness has enabled materials (XLB) to continue a bounce off deeply oversold conditions. Here's the latest chart on the XLB:
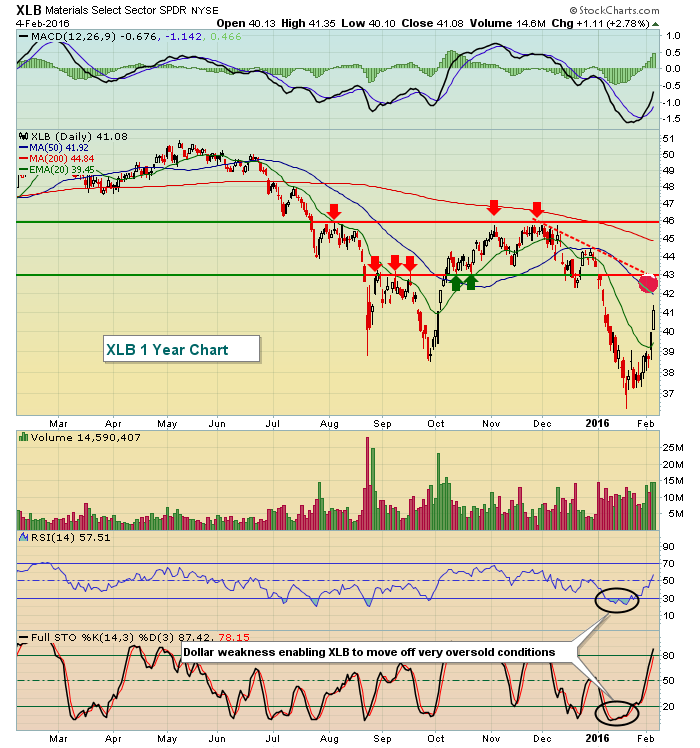 The XLB would seem to be approaching a key short-term resistance area (red circle) between 42-43. The 50 day SMA is currently just beneath 42, then there's price resistance close to 42.50 that was established on the recent price low that was lost from mid-December. Also, gap and trendline resistance both intersect near the 43 level. Should the USD lose price support near 93, the XLB could continue its surge for quite some time, especially considering how oversold it was. The long-term trend here, however, is down so I'm expecting the 42-43 level to hold as resistance. We'll see.
Pre-Market Action
The 10 year treasury yield ($TNX) was lower this morning once again as money pours nearly unabated into treasuries. I view the treasury market as the "brains" of various asset classes so a falling TNX suggests extreme caution with any stock market bounce. It likely won't last unless we see an exodus out of the defensive treasuries, resulting in a rising TNX. Update: After an uninspiring nonfarm payrolls number fell short of expectations, the TNX has risen back to the unchanged level. One possible explanation is that treasuries have been bought in anticipation of this disappointing jobs number and we're seeing short-term profits taken. Whether the reversal in fortunes continues will have a big impact on equity trading today. Another fresh low in the TNX later today would not be good news to a volatile and fragile U.S. stock market.
The weak jobs numbers has sent U.S. futures lower, but the losses have been contained thus far. The S&P 500 is down 8 points at last check although volatility could certainly accelerate. It's hard to imagine the stock market taking this latest economic blow in stride, but we'll soon find out.
Overnight, Asian markets were mixed with the Hang Seng ($HSI) the only major index rising. Tokyo's Nikkei ($NIKK) stumbled 1.3% and is perilously close to a major breakdown on its long-term weekly chart. Have a look:
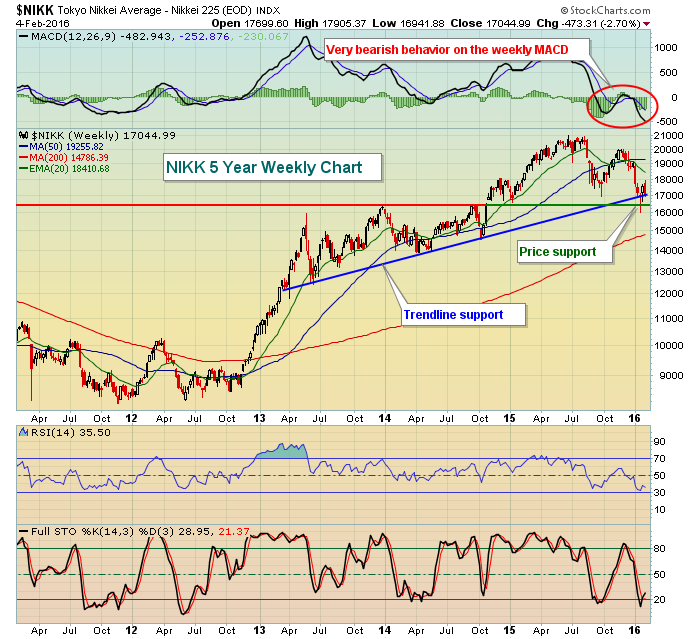 Given the weak momentum, price and trendline breakdowns would only add the recent misery on the NIKK.
Current Outlook
Yesterday, materials led the stock market's rebound. Prior to that, it's been the bounce of a beaten-down energy sector (XLE) to lift equity prices. And then, of course, there's been the leadership of defensive areas of the market like utilities and treasuries. It's difficult to get excited about the sustainability of an advance when areas like technology and consumer discretionary underperform. Have you seen Google's (GOOGL) performance since its solid earnings were released? Check this out:
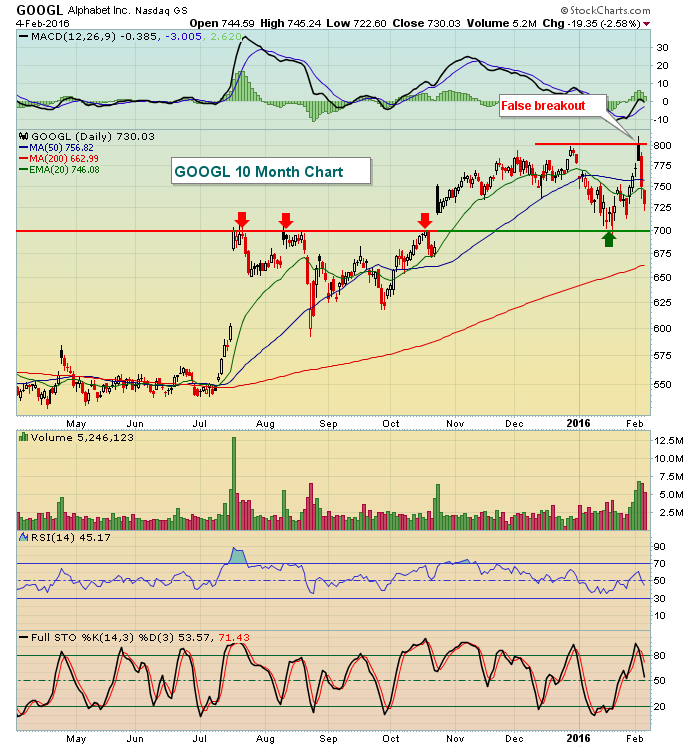 High growth oriented stocks like GOOGL are struggling despite excellent quarterly results and you have to wonder why. Based on all the rotation to defense in the market, the message being sent is that growth ahead is very likely to slow. The stock market is priced looking at growth prospects.
But short-term there was a big selloff in January with volatility ($VIX) soaring. I found it interesting that our major indices were all higher on Thursday and yet the VIX still rose fractionally. Nerves are on edge and that's a recipe for lower prices. When that fear meter rises, it's letting us know that stock market cannot handle bad news and will routinely ignore good news.
Sector/Industry Watch
I've been asked to cover automobiles ($DJUSAU) recently, so let's check in on the group:
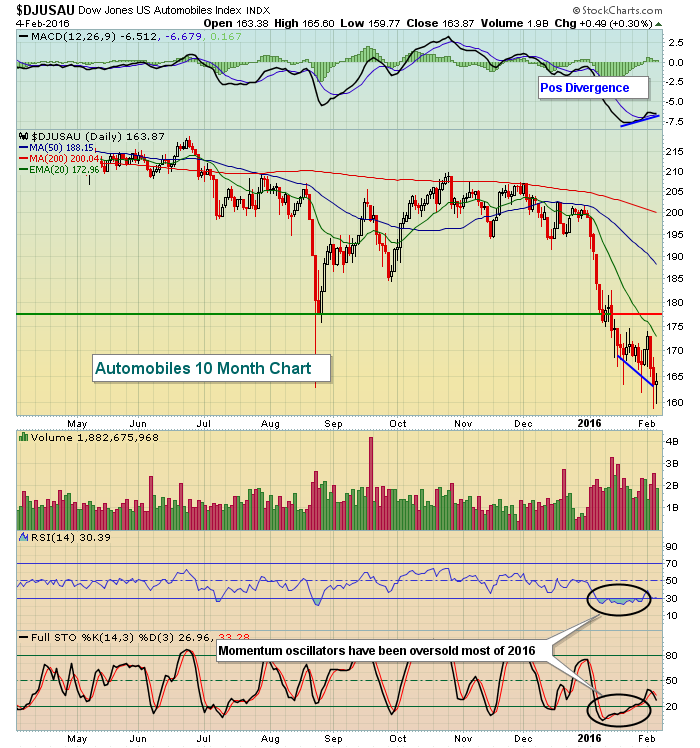 Not reflected above is the fact that the weekly chart shows the DJUSAU breaking below the 180 level for the first time since 2013 and a weekly MACD that has been primarily in negative territory for the past year and a half. In other words, long-term momentum is very weak and suggests that, other than a temporary oversold bounce, this group is likely heading lower. The positive divergence on the daily chart provides short-term hope for that bounce to possibly the 180 area. That rally is highly questionable, though, due to the strong volume that's been accompanying the selling. That begs the question, "is the selling momentum truly slowing as the MACD suggests"? Tough group to call the short-term direction so I'd avoid.
Historical Tendencies
The next few days tends to be bearish for the S&P 500 based on data since 1950. Today's (February 5th) annualized return is -18.26% and it won't get any better to start next week as February 8th (Monday) and February 9th (Tuesday) have produced annualized returns of -17.88% and -68.61%, respectively.
Key Earnings Reports
(actual vs. estimate):
AON: 2.27 vs 2.09
CME: .92 vs .90
EL: 1.22 vs 1.09
MCO: 1.09 vs 1.05
TSN: 1.15 vs .87
WY: .24 vs .24
Key Economic Reports
Nonfarm payrolls released at 8:30am EST: 151,000 (actual) vs. 188,000 (estimate)
Nonfarm private payrolls released at 8:30am EST: 158,000 (actual) vs. 180,000 (estimate)
Unemployment rate released at 8:30am EST: 4.9% (actual) vs. 5.0% (estimate)
Average hourly earnings released at 8:30am EST: +0.5% (actual) vs. +0.3% (estimate)
Happy trading!
Tom


