Special Note: If you missed our joint webinar on Friday, Greg Schnell and I will be back at it and hosting another joint one hour webinar today. We had a huge crowd on Friday and the two of us providing our own distinct views generated much interest. The webinar is FREE and starts at Noon EST. We'll provide our views on the crazy selling that's taken place and offer up possible downside targets for the major markets, both here in the U.S. and abroad. CLICK HERE to register. Hope to see you there!
Market Recap for Friday, February 5, 2016
The U.S. stock market fell sharply on Friday with the NASDAQ and Russell 2000 posting the largest percentage losses at 3.25% and 2.87%, respectively. It was once again a flight to safety as utilities (XLU) was the only sector to finish the session with a gain. Consumer staples (XLP) was down just .16% while its more aggressive consumer counterpart, consumer discretionary (XLY), tumbled 3.23%. Technology (XLK) also had a very rough day as this sector fell 2.81%.
One of the top stories of the day was LinkedIn (LNKD), the social media company, as its shares plunged 43.6% on Friday. Tableau Software (DATA) dropped 49.4%. Both companies confessed that consensus estimates for their revenue and profit outlooks for 2016 were too rich. In a market that will no longer tolerate bad news, they were both slammed at the opening bell.
Pre-Market Action
Futures in the U.S. are following weakness from around the globe overnight. European markets are down from 2.0%-3.0% with the German DAX ($DAX) continuing lower by 2.7% (at last check) after closing at a 15 month low on Friday. The China and Hong Kong markets were closed overnight in observance of Lunar New Year. Japan's Nikkei ($NIKK) managed to tack on 1% last night.
The U.S. treasury market continues to gain momentum as buyers flock to that safe haven. As a result, the 10 year treasury yield ($TNX) has fallen to 1.80% and apparently has its sights set on a retest of the February 2015 low at 1.65%. That would likely coincide with a falling S&P 500 as well.
There is no significant economic data due out today so that leaves the market trading off of technical conditions - and that's not a good thing right now, especially with global markets under pressure.
Current Outlook
Stay away from aggressive growth stocks. LNKD and DATA are two extreme cases of what can go wrong when you hold a stock into its earnings report. Just remember that the Volatility Index ($VIX) remains elevated in the 20s and it's currently trending higher. Here's the latest visual:
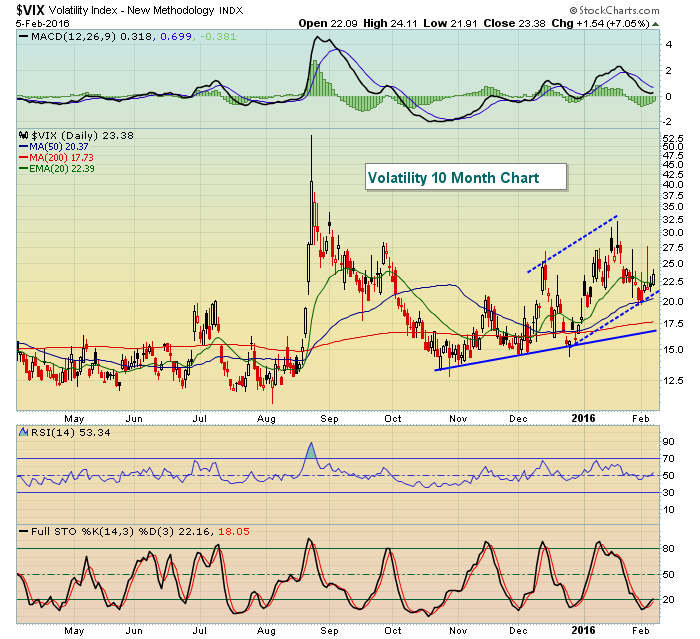 If you review history, you'll find that holding stocks on the long side with a VIX trending higher is generally a recipe for disaster. From the chart above, we have been witnessing a steadily increasing VIX since the October low and there's a more current channel that is screaming higher. That's the stock market's way of explaining that it cannot handle bad news.
Given the tumbling futures today, expect to see another serious rise in the VIX at the opening bell.
Sector/Industry Watch
The Dow Jones U.S. Real Estate Services index ($DJUSES) printed a positive divergence last week, but it served an important reminder. You must allow the momentum to the downside continue to see if the positive divergence holds. Take a look at the DJUSES as of last Tuesday's close (Feb 2nd):
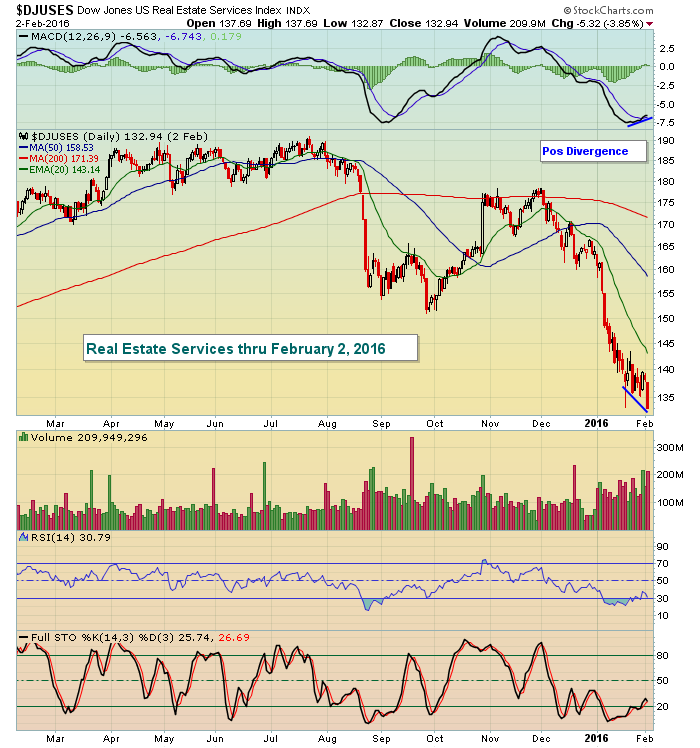 There's a clear positive divergence, right? Price action has turned lower with a higher MACD reading. That, by definition, is a positive divergence and indicative of slowing momentum. Those with tunnel vision would buy this group at the current price of 132.94 (assuming you could buy the index), looking for a price reversal. Here's the rest of the week's action:
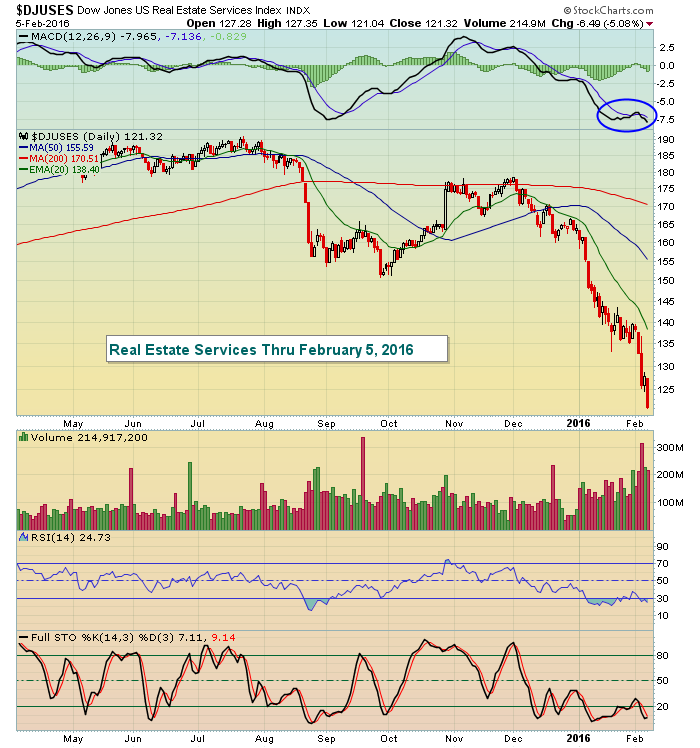 Huh? What happened? I just lost 8% in three days. You scream, "technical analysis doesn't work!!!" Well, I wouldn't go that far. First, I find it very difficult to conclude that selling momentum is slowing in that first chart when the DJUSES breaks to a fresh new low on MONSTER volume. If anything, selling momentum is accelerating to me. Remember, the MACD only considers price action. Common sense suggests heavy volume selling is not slowing momentum. I've written a couple pieces in my blog about how I use the MACD and common misinterpretations. Here are two that you might want to review:
Historical Tendencies
Last week I indicated that the S&P 500 tends to struggle through tomorrow's close. There is a bullish historical period for small cap stocks (Russell 2000) that begins at the close on Wednesday, February 10th. Here are the annualized returns for each of those several days:
February 11 (Thursday): +123.90%
February 12 (Friday): +49.60%
February 15 (next Monday): +44.86%
February 16 (next Tuesday): +55.55%
Key Earnings Reports
(actual vs. estimate):
CTSH: .74 vs .71
HAS: 1.39 vs 1.30
L: .46 vs .78
(reports after close, estimate provided):
FOXA: .44
Key Economic Reports
None
Happy trading!
Tom


