Market Recap for Tuesday, February 9, 2016
U.S. stocks were lower throughout much of the session on Tuesday before rallying in early afternoon action to move into positive territory with one hour left. Unfortunately, another round of quick selling emerged and all of our major indices finished lower once again. The good news was that five sectors closed higher. The bad news is that the industrial sector (XLI) was the only aggressive sector to do so. Healthcare (XLV) performed well overall, but its weakest industry group was biotechs ($DJUSBT) - the aggressive part of the XLV.
Materials (XLB) was the leading sector as containers & packaging ($DJUSCP) and specialty chemicals ($DJUSCX) both performed very well. They both bounced with poor technical conditions, however. The latter's weak technicals are shown below:
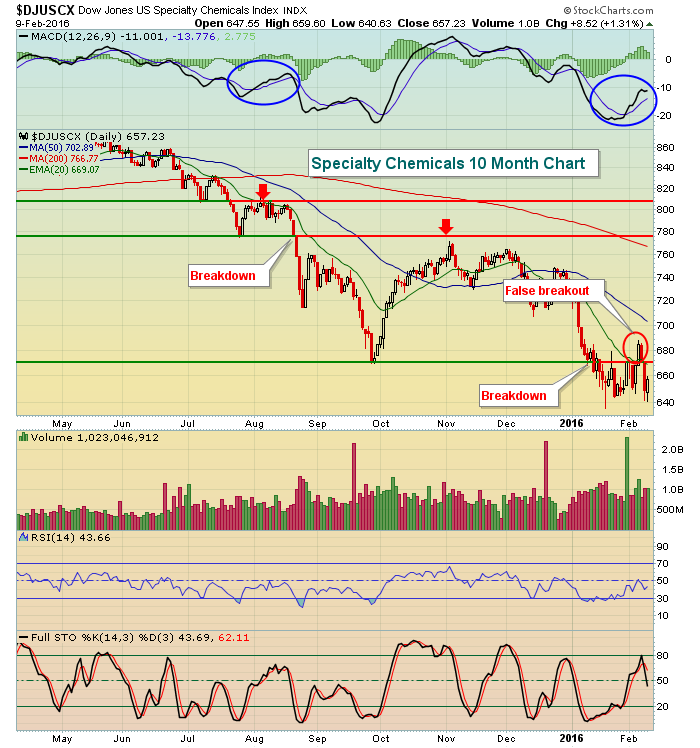 So yes the DJUSCX was among the leaders on Tuesday, but I'm not excited by this leadership for two reasons. First, it's not among the aggressive areas of the market. And second, this chart looks awful. I think it's obvious we're downtrending. While the MACD has turned more favorable, we've seen this story before. It looks eerily similar to the July/August conditions - just before the meltdown. The recent false breakout above the 20 day EMA was particularly disappointing and speaks volumes about the lack of faith in this area by traders. The DJUSCX was poised to close at fresh lows before a kick save on Tuesday so the short-term has improved, providing better odds for a rally into the 670-690 zone. Beyond that, though, the longer-term remains technically bleak in my view.
Pre-Market Action
Fed Chair Yellen has provided a statement of her upcoming address to the House Financial Services Committee, scheduled for 10:00am EST this morning. The statement reflects the FOMC's opinion that the Fed needs to see how the current financial turmoil unfolds before deciding what to do at its March meeting. That's a great way to clear the air of any uncertainty <sarcastic shrug>.
There was continuing pressure overnight in Japan as its benchmark Nikkei ($NIKK) shed another 2.3% after breaking down following a 5%+ tumble Monday night. China's Shanghai Composite ($SSEC) fell again as it marches toward a likely encounter with 2400-2500 support. The Hang Seng Index ($HSI) managed to move against the grain, adding 0.55% overnight.
European banks rebounded and that's led to strength across the pond. Germany ($DAX) and France ($CAC) are both higher by more than 2% while the London FTSE ($FTSE) is up a more modest 0.5% - at last check. The CAC, in particular is worth watching as longer-term support near 4000 is being tested.
Consumer discretionary stocks (XLY) have been shredded here in the U.S. lately, especially when compared to the treatment their staples counterparts (XLP) have been afforded. This morning, it's Walt Disney's (DIS) turn as key support at 90 is being lost on heavy pre-market volume. Check out the chart:
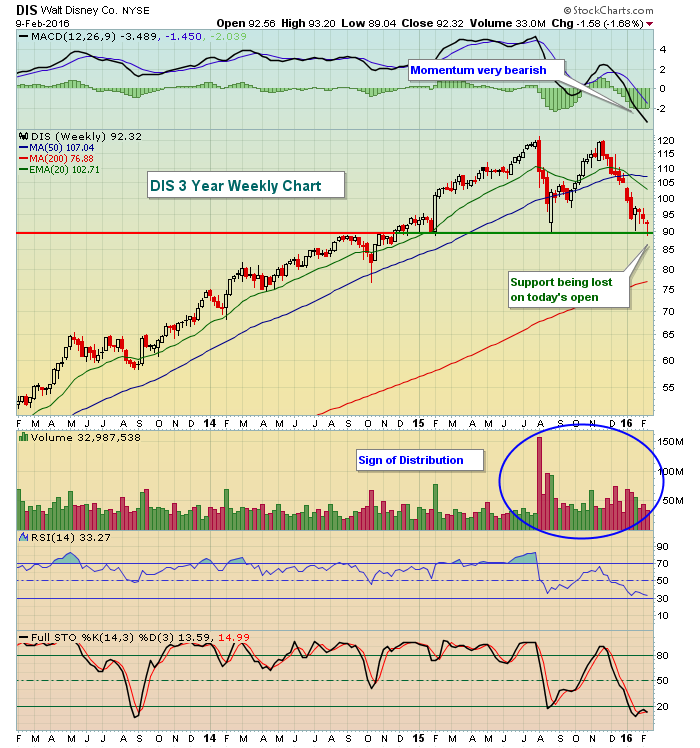 DIS beat on both top and bottom lines, but worries over ESPN have the stock under heavy pressure in pre-market trading, down 5%.
Current Outlook
There are a number of reasons to expect a short-term rally soon. First, we're moving into a more favorable part of the month historically. Second, the S&P 500 has again moved near 1850 to test prior lows. Check this out:
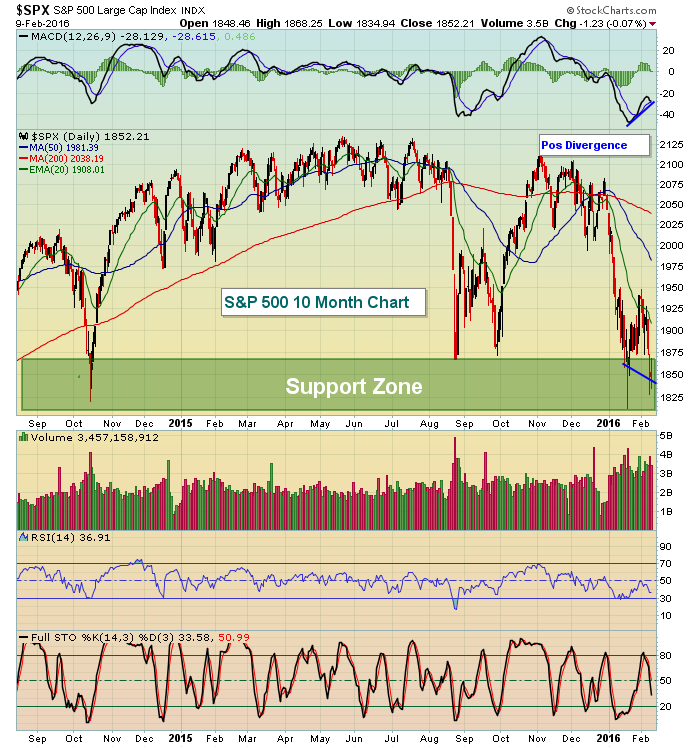 Third, there's a positive divergence on the most recent price lows. Fourth, the 10 year treasury yield ($TNX) is extremely oversold and nearing major support at 1.65%. A bounce in yields means money would rotate away from bonds - even if only temporarily - to allow more money to rotate into equities. Here's the current chart on the TNX:
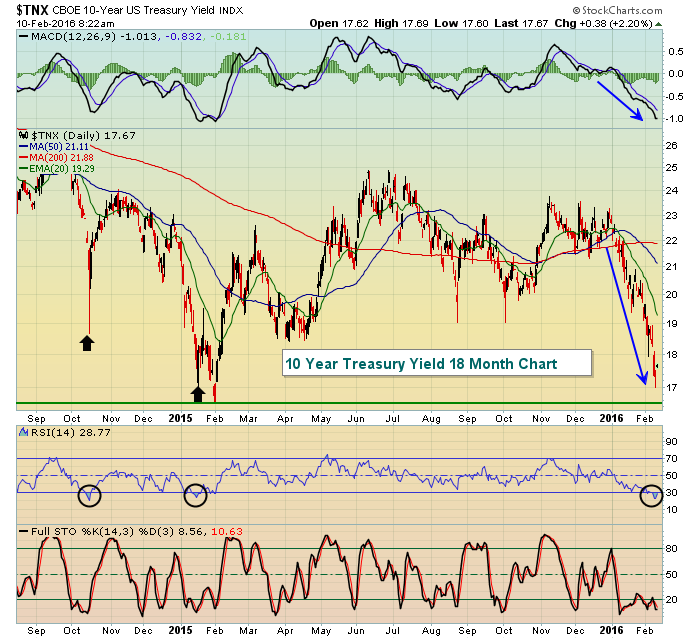 It's been a straight move lower in 2016 in treasury yields, but RSI has dipped below 30, a level where we've normally seen a bounce. Fifth, the Volatility Index ($VIX) printed a black, reversing candle near resistance (see Sector/Industry Watch section below for current chart on the VIX). Sixth, if we do make another low, we'll likely see positive divergences emerging everywhere on 60 minute charts.
While there seem to be a lot of positives taking place right now, I'll offer up two warnings. First, the combination of price/volume is firmly in the bearish camp despite prior S&P 500 price lows holding for now. Secondly, and very importantly, rotation in the stock market over the past few months has been absolutely horrid. I've never seen this kind of rotation toward safety just before a major move higher in a bull market.
Conclusion: While the odds do favor a rally from here, keep your stops in place. Price support in the lower 1800s is a big, big deal. If it's lost, the selling could resume in a powerful way.
Sector/Industry Watch
The VIX appears to have a reached a near-term high as seen below:
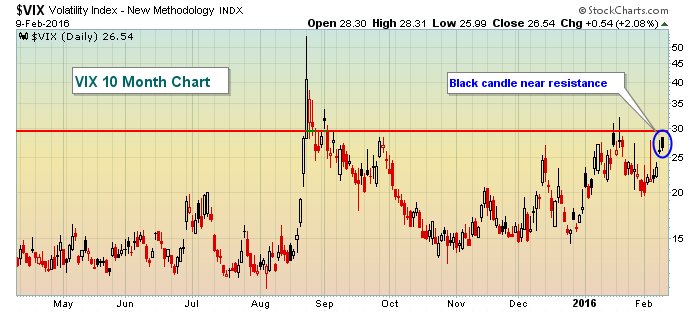 A move back into the lower 20s shouldn't be ruled out here.
Historical Tendencies
The S&P 500 just ended a bearish part of February and now looks ahead to brighter, sunnier historical skies. Here are the S&P 500 annualized returns (since 1950) over the next few calendar days:
February 10 (today): +0.88%
February 11 (Thursday): +14.83%
February 12 (Friday): +19.46%
February 15 (Monday): +33.47%
It may not seem like much, but given the current state of the stock market, anything helps.
Key Earnings Reports
(actual vs. estimate):
HUM: 1.45 vs 1.46
TWX: 1.06 vs 1.01
(reports after close, estimate provided):
AEM: (.01)
BIDU: .86 (yahoo reported 2/9 earnings date; zacks shows 2/10 but no time provided)
CSCO: .44
EFX: 1.11
EXPE: .89
GMCR: .66 (yahoo reported 2/5 earnings date; zacks shows 2/10 but no time provided)
JCOM: .77
MYL: 1.25
ORLY: 2.07
PRU: 2.27
SKX: .20
TSLA: (.34)
TWTR: (.13)
WFM: .40
Key Economic Reports
None
Happy trading!
Tom
