Market Recap for Monday, February 8, 2016
While the U.S. market continued its downward spiral, Tokyo's Nikkei Average ($NIKK) fell more than 5% overnight, losing critical price and trendline support. Check it out:
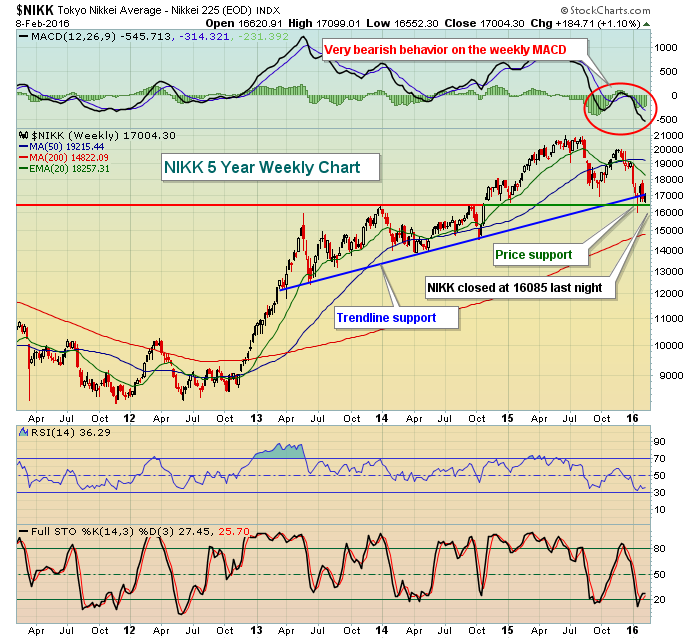 This chart was shown last week with the key price and trendline support reflected. Last night's action is NOT on this chart, but the NIKK closed at 16085, which is in clear violation of both technical support levels - yet another bearish sign in a long line of them.
All nine sectors closed lower on Monday, led by materials (XLB), financials (XLF) and consumer discretionary (XLY).
Pre-Market Action
In addition to the poor action in Japan last night, yesterday was not a good day technically for the German DAX ($DAX). We saw a clear breakdown there as reflected below:
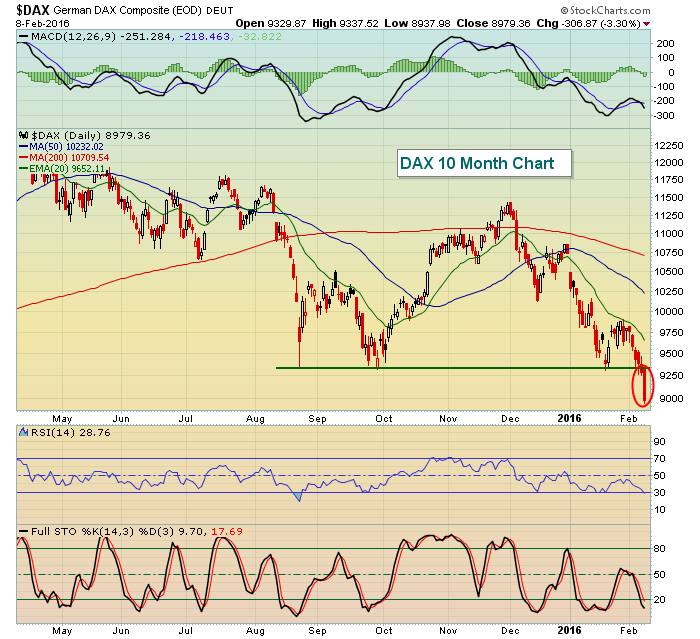 The global breakdowns are impacting technical action here in the U.S., especially with little economic news out yesterday and today.
Current Outlook
The text of Fed Chair Janet Yellen's semi-annual testimony on monetary policy to the House Financial Services Committee will be provided Wednesday 8:30am EST, a bit before she reads the statement to the Committee. This statement is likely to be heavily scrutinized given the recent financial turmoil around the globe. The Dow Jones U.S. Banking index has been under much selling pressure and, in the past several weeks, has lost multi-year price support. Financial markets are undermined by the instability of banks so the following chart should most definitely be of concern:
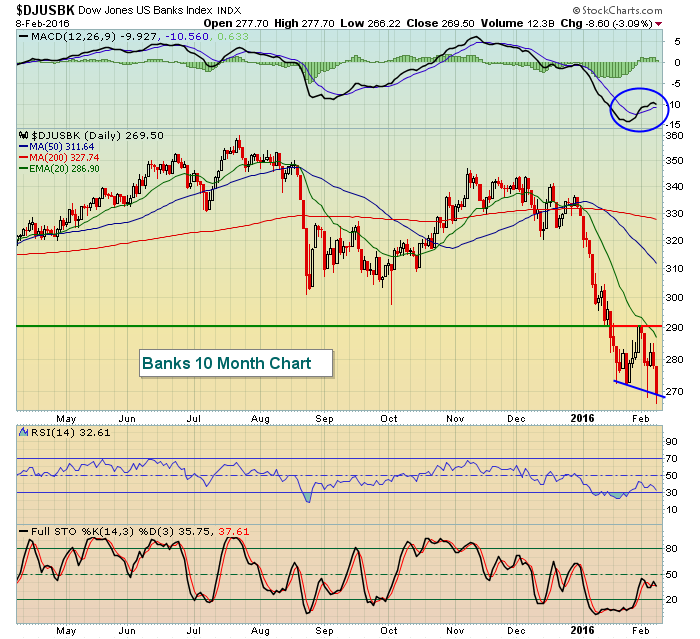 Monday's close set a fresh new low, which is the bad news. The good news is that it currently shows a positive divergence. However, these positive divergences can be lost with further selling pressure. So I generally look for a reversing candle before acting on divergences. The bottom of the reversing candle can then provide a reasonable stop should selling resume. The horizontal line highlights longer-term support near 290 that was recently tested from underneath after the mid-January breakdown. 290 now becomes key short-term resistance on any bounce in this group.
Sector/Industry Watch
Financials broke to fresh new closing lows on Monday and did so on increasing volume. This is a bearish combination and with the Volatility Index ($VIX) at 26, we must be prudent on the long side and recognize the more impulsive selling episodes are likely. Here's Monday's breakdown:
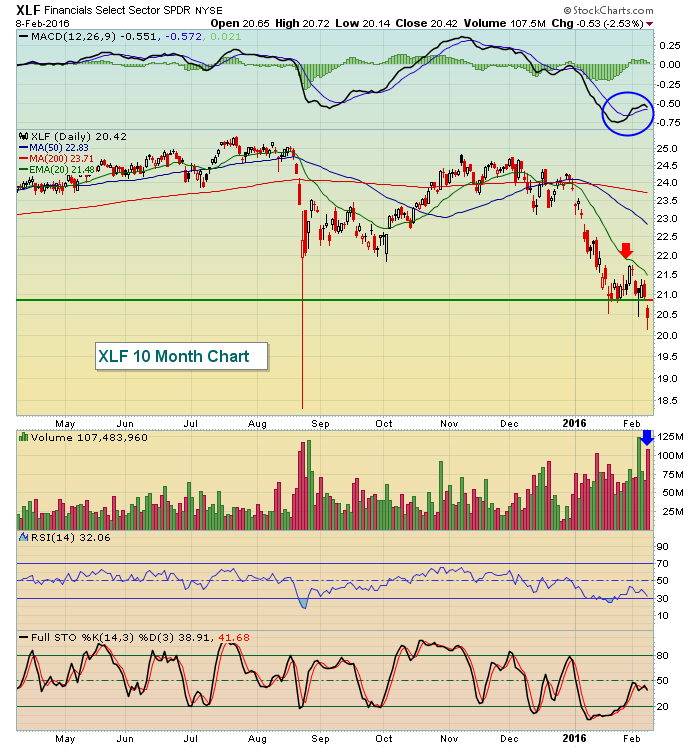
The blue arrow highlights the big surge on volume while the red arrow shows the test of the declining 20 day EMA failing. The MACD is higher than on its last low, but the heavy volume does not suggest slowing momentum on the sell side. Be cautious.
Historical Tendencies
Many refer to Tuesdays as "turnaround Tuesdays". Mondays are the worst day of the calendar week and Wednesdays through Fridays tend to be strong, so many times we'll see reversals on Tuesdays. Yesterday was certainly weak so we'll have to see if today can be one of those "turnaround Tuesdays".
Key Earnings Reports
AIZ: 1.54
AKAM: .51
AMX: .43
CSC: .69
CVS: 1.53
DIS: 1.44
GT: .74
IGT: .40
IR: .93
KO: .37
PNRA: 1.78
REGN: 2.69
VIAB: 1.17
Key Economic Reports
December wholesale trade to be released at 10:00am EST: -0.1% (estimate)
Happy trading!
Tom


