Market Recap for Monday, March 14, 2016
There was weakness during the first 15 minutes of trading on Monday, then again during the last 15 minutes of trading. Prices meandered higher throughout much of the remaining session, however, and left our major indices bifurcated by the close. The Dow Jones and NASDAQ both posted gains of less than 0.10% while the S&P 500 and Russell 2000 finished in the red. The Russell 2000's 0.30% loss was the worst performance of the four.
Consumer discretionary (XLY) was the pace setter on Monday, climbing 0.38%. Leading the sector was hotels ($DJUSLG), whose chart is featured in the Sector/Industry Watch section below. That group rose 2.52% on the session. Only the highly volatile nonferrous metals ($DJUSNF) performed better among all industry groups. Also leading consumer discretionary was the restaurants & bars ($DJUSRU), which gained 1.04%. Keep a close eye on this group as it's approaching major price resistance, as reflected below:
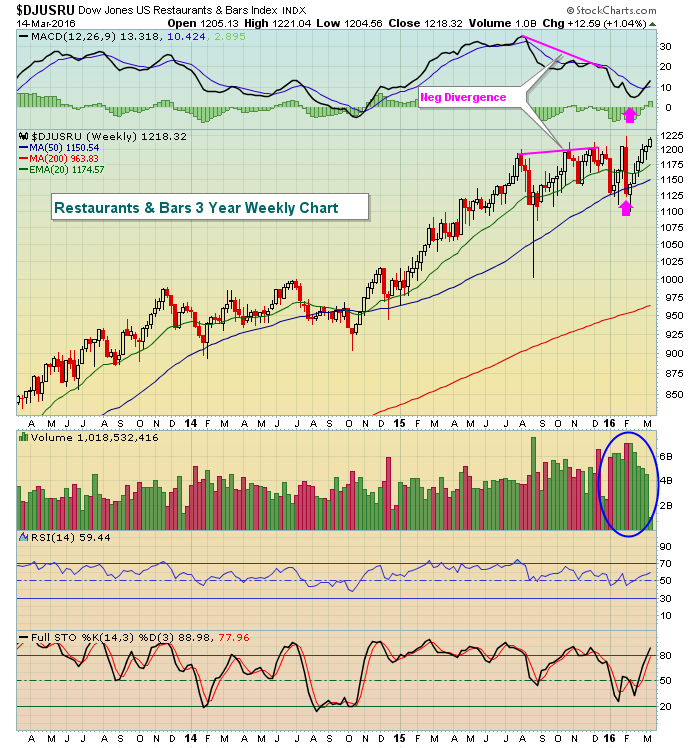 Restaurants & bars ran into slowing momentum in 2015 as prices kept rising while the MACD rolled over. That generally results in either steep selling or an extended period of consolidation in order to unwind the weekly MACD back to centerline support. While the MACD never quite reached centerline support, there was a 50 week SMA test prior to the renewed strength the past six weeks. Note the heavy volume accompanying this price rise. Also, the DJUSRU closed on Monday at its highest daily level ever. Should the six year bull market resume, this is most definitely an area poised to lead.
Pre-Market Action
There were a number of economic reports out this morning and still a couple more to go at 10am EST. The news out today has been mostly encouraging, especially a better-than-expected empire state manufacturing survey. Traders were expecting another steep negative number, but surprisingly it came in positive. It hasn't done much to sway futures, which are negative this morning to the tune of nearly 100 points on the Dow Jones, but it will be interesting to see how the market anticipates the Fed announcement due out on Wednesday afternoon. Remember, the European Central Bank (ECB) just announced more quantitative easing. What will Fed Chair Yellen have to say about that and economic conditions here in the U.S.? Also, what is the Fed thinking in terms of future interest rate hikes? All of this will likely keep market participants on edge.
Overnight in Asia, the China Shanghai Composite ($SSEC) rose very slightly, while its Tokyo and Hong Kong counterparts finished fractionally lower. In Europe, we're seeing weakness across the board with the most notable technical development being the German DAX failure once again near the 10000 level. Closing above that psychological level would likely provide a lift to U.S. stocks as well.
The 10 year treasury yield ($TNX) is struggling thus far in its attempt to clear 2.00% resistance, dropping nearly four basis points, perhaps somewhat in reaction the downwardly-revised January retail sales. February's retail sales were reported in line with estimates.
Current Outlook
I'll focus today on the intraday hourly charts and use the NASDAQ as my illustration. Over the past month, we've seen two instances of negative divergences emerging during the rally and they both temporarily put a halt to the advance before the next leg higher. Here's the visual:
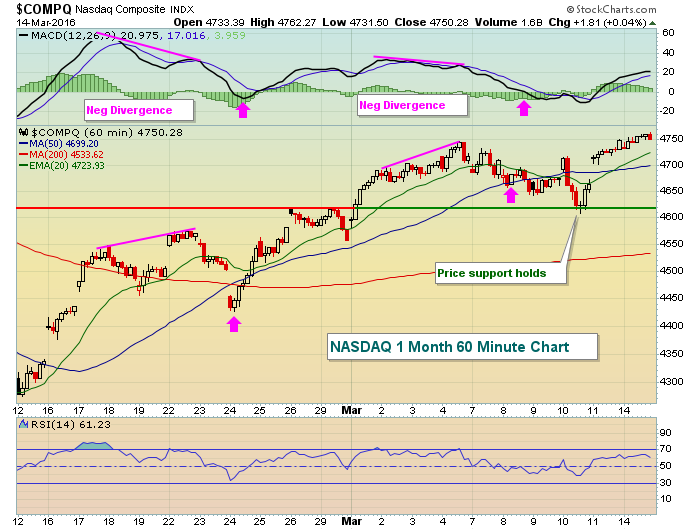 The pink lines highlight the negative divergences that appeared in February and again in early March. Prior to both divergences printing, price action remained above 20 hour EMAs. Once those signs of slowing momentum arrived, though, selling intensified down to 50 hour SMAs (or slightly below) to "reset" the MACD back to its centerline, or zero line. At that point, momentum is gone as the definition of a MACD centerline test is that both the short-term and long-term moving averages used (I always use the default - 12 and 26 period EMAs) are equal.
Currently, the hourly MACD is trending higher off of its latest centerline test. So very short-term traders should be looking for the rising 20 hour EMA to provide support on weakness. That moving average is currently at 4724. The most interesting part of this chart is that price support resides at 4620. Why is that level so important? Because it's also a major support area now on the daily chart as well. Check this out:
 A few quick points here:
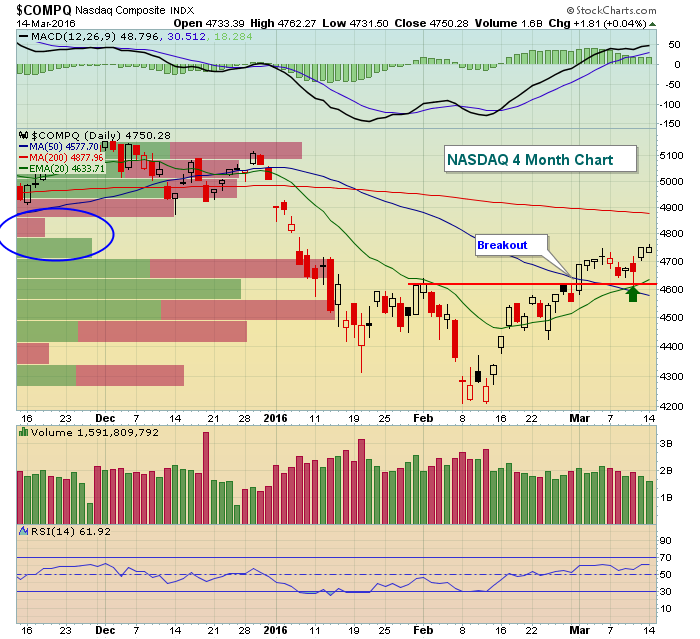
1. The volume by price bars show there's been very little action between 4700 and 4900, which is great news if you're bullish. We could see an unabated move to 4900 to test the next level of resistance and that's another 3.00-3.25% higher from Monday's close.
2. The green arrow marks a key test, successful I might add, of the rising 20 day EMA - a bullish signal
3. The horizontal red line marks an area of gap resistance from February 1st that was cleared on March 1st on increasing volume so that now becomes price support. Remember, TA 101 starts with broken price resistance becomes price support. The level of price support is 4620, which is the same level of price support reflected on the 60 minute chart earlier.
Sector/Industry Watch
The Dow Jones U.S. Hotels Index ($DJUSLG) made a significant bullish breakout above neckline resistance in a reverse head & shoulders pattern (in red below). While the pattern measures to 1300 potentially, I'd likely set a short-term target on this industry at 1200-1225 to test earlier price highs. That could establish the right side of the neckline of a bigger picture reverse head & shoulders (in black below). Check it out:
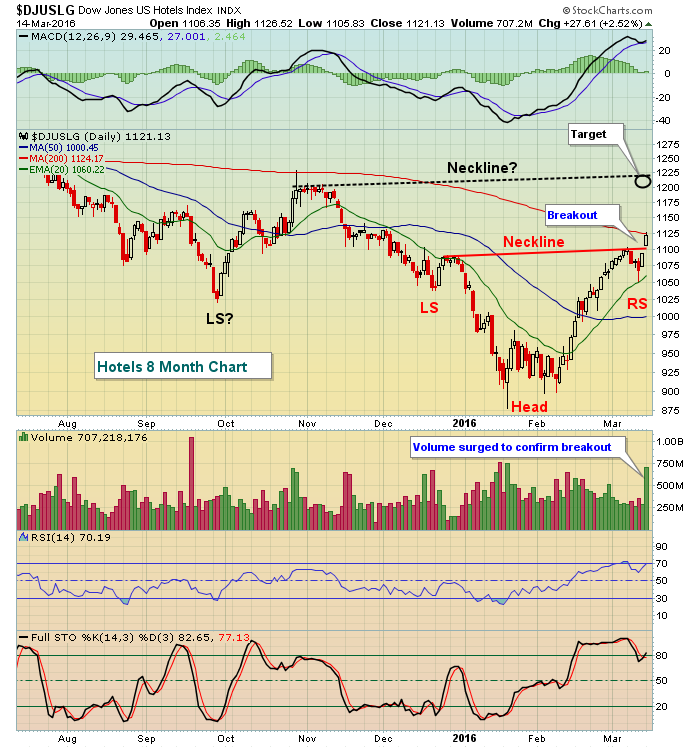 Many times, pattern breakouts are only as strong as the volume that accompanies the breakout. In this case, the volume surge is quite apparent. I would now look for two levels of support on the DJUSLG - the first at neckline support near 1100 and then the rising 20 day EMA, currently at 1060.
Historical Tendencies
The first half of most calendar months outperforms the second half and March is no different. Since 1971 on the NASDAQ, here are the annualized returns for the following periods:
March 1-15: +14.00%
March 16-31: +4.10%
Key Earnings Reports
(actual vs. estimate):
FDS: 1.59 vs 1.52
VRX: 2.50 vs 2.64
(reports after close, estimate provided):
ORCL: .58
Key Economic Reports
February PPI released at 8:30am EST: -0.2% (actual) vs. -0.2% (estimate)
February Core PPI released at 8:30am EST: +0.0% (actual) vs. +0.1% (estimate)
February retail sales released at 8:30am EST: -0.1% (actual) vs. -0.1% (estimate)
February retail sales ex-autos released at 8:30am EST: -0.1% (actual) vs. -0.2% (estimate)
March empire state manufacturing report released at 8:30am EST: 0.62 (actual) vs. -11.25 (estimate)
January business inventories to be released at 10:00am EST: +0.0% (estimate)
March housing market index to be released at 10:00am EST: 59 (estimate)
Happy trading!
Tom


