Special Note
In the Sector/Industry Watch section below, I highlight the historical and current February to April strength in the Exploration & Production ($DJUSOS) industry group within the energy sector (XLE). I plan to discuss how you can research historical strength by sector and industry group in my Trading Places LIVE webinar at noon EST today. CLICK HERE to register for today's one hour webinar. Also, please subscribe to my blog and have my articles sent to your email as soon as they're published. Simply click on YES to the question posed after the end of today's article and provide your email address. Thanks and I hope to see you at noon EST today!
Market Recap for Friday, March 11, 2016
Energy (XLE) was once again responsible for solid action in the S&P 500 as the XLE rose 2.58% on Friday. Financials (XLF) also joined the party, climbing 2.60% to lead all sectors. Perhaps the best news was that all sectors rose, providing broad participation in the rally. The defensive consumer staples (XLP) and utilities (XLU) lagged badly, but moved higher - exactly what you want to see if you're in the bullish camp.
Home construction ($DJUSHB) rose 3.29% on Friday to near its pivotal 550 level as can be seen from the following chart:
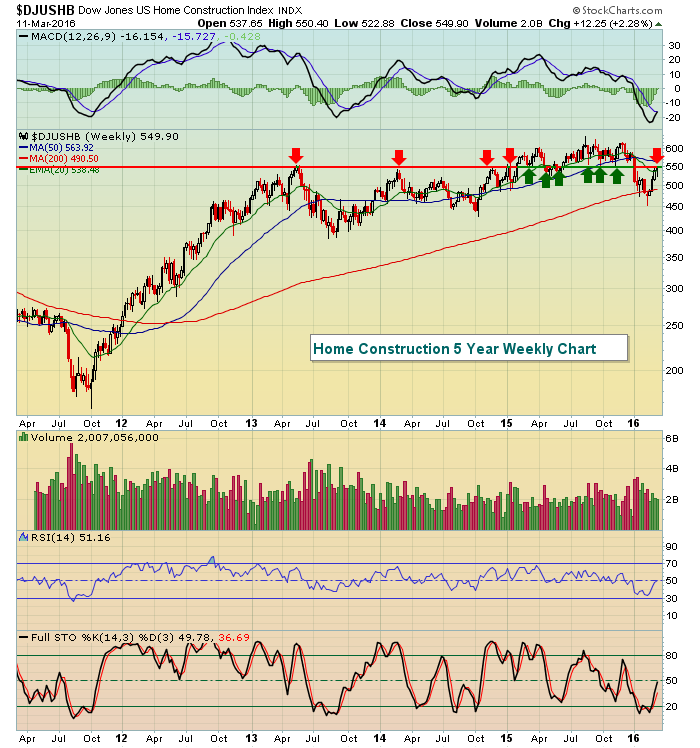 Prior to the current test, I count at least nine separate tests of 550 support/resistance over the past three years so Friday's close at 549.90 should be respected as solid resistance - until it's not. Keep in mind this a weekly chart. A move above 550 intraweek and a close below could mark a top as it's done so many times in the past few years.
Pre-Market Action
The Tokyo Nikkei ($NIKK) was higher by 1.75% overnight, while the Hong Kong Hang Seng ($HSI) index tacked on 1.17%, clearly spurred by solid action in the U.S. on Friday. The bad news technically is that both of these Asian markets trade below their declining 20 week EMAs and are approaching a very significant technical test. China's Shanghai ($SSEC) also posted a 1.75% gain, but remains below the key 3000 resistance level.
In Europe, major indices are rallying there as well. The index I pay most attention to is the German DAX ($DAX), which is nicely higher by 1.50% at last check to once again threaten 10000. Here's the big picture weekly chart on the DAX:
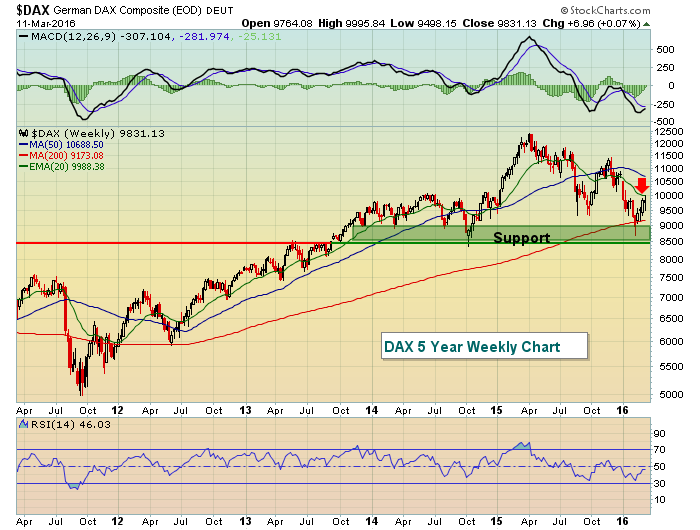 Like the benchmark S&P 500 here in the U.S., the DAX held October 2014 price support on its recent low and the current rally is now challenging the declining 20 week EMA and 10000 price resistance (red arrow). A weekly close above 10000 would likely trigger further technical buying and pose greater risk to those on the short side.
U.S. futures are slightly lower this morning after trading close to the flat line overnight.
Current Outlook
Transitioning, or potentially transitioning, markets are the hardest to trade. Why? Because in bull markets you trade by bull market rules. In bear markets, you simply turn your computer monitor upside down as rallies typically fail and the bigger picture downtrend rules. We're somewhere in the middle right now. Bull market trading strategies haven't worked very well the past several months and the current five week rally is inflicting pain if you're following bear market strategies. The most important technical indicator, in my view, is the combination of price and volume, which is being driven home right now. Take a look at the long-term weekly chart of the S&P 500 and you'll see that the important October 2014 low has not been taken out and that really was the last technical hope for the existing bull market. Here's the chart:
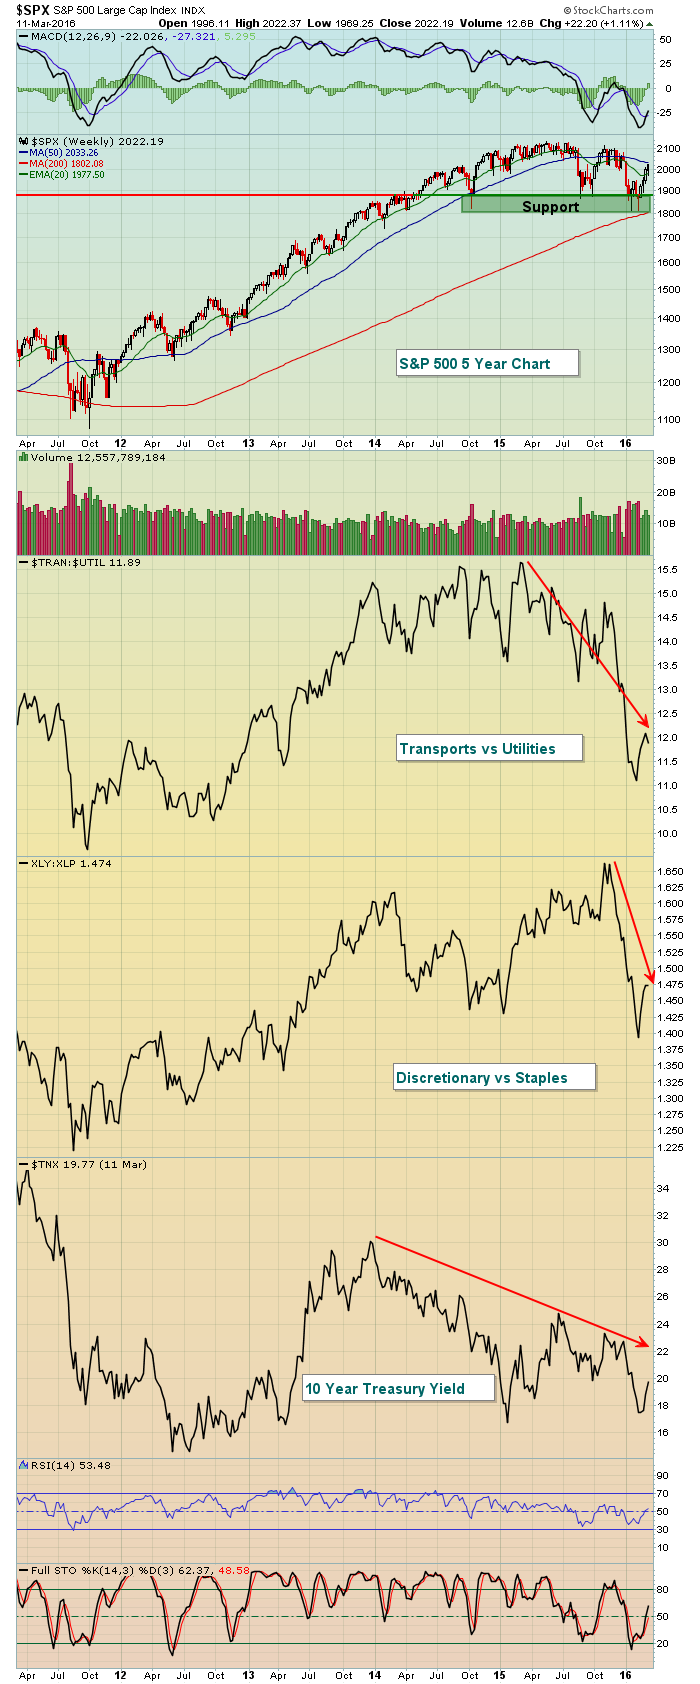 This chart really depicts the problems that bulls and bears face. There is a very important price support level in the 1800s that must hold or technical selling will accelerate. We've seen panicked lows set near 1800 on multiple occasions, but buyers have continued to emerge there. That's the primary issue for the bears. Can they maintain control of the action long enough and will the selling momentum be strong enough to clear major price support?
Then there's the bulls' issues, namely sector rotation. The relative ratios above, consumer discretionary (XLY) vs. consumer staples (XLP) and transports ($TRAN) vs. utilities ($UTIL), are climbing during this rally, but both are far, far away from the highs set in 2015. In other words, this rally is occurring with a major shift from offense to defense. Then throw in the performance of treasuries. Their rally since the summer of 2015 (and accompanying decline in the TNX) is disturbing because of the defensive nature of that asset class. Bottom line, the current rally is being led mostly by rotation to defense and the sudden resurgence in energy and materials stocks. Ironically, it was weakness in those latter two groups that haunted the bulls in late 2014 and throughout 2015. Now these two groups are helping to stave off the bear attack and, based on current improving technical conditions, may continue to do so.
Sector/Industry Watch
Over the past twenty years, the XLE has performed its best during the calendar months of February and March, posting average monthly gains of 3.0% and 3.5%, respectively. Much of that historical strength can be attributed to the Dow Jones U.S. Exploration and Production Index ($DJUSOS), which has routinely gained ground from February through April. 2016 has been no different as you can see below:
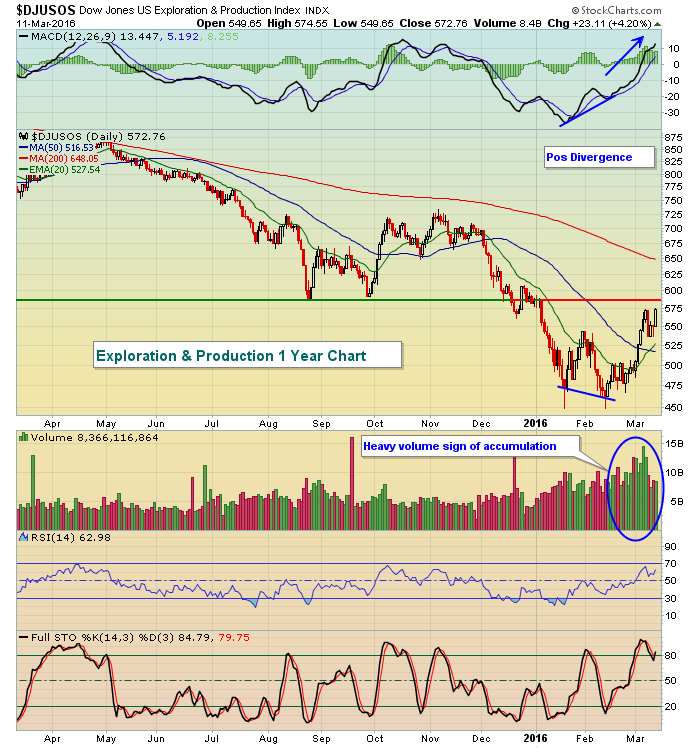 Heavy volume on this latest rally is a sign of accumulation and momentum is strengthening to the upside. The double bottom was accompanied by a positive divergence and appears to have marked a very significant bottom for this industry group.
Historical Tendencies
Since 1971, the NASDAQ has risen 56% of the days, but Mondays have been a major exception. Mondays have risen just 47% of the time and have posted a negative annualized return of more than 31%.
Key Earnings Reports
None
Key Economic Reports
None
Happy trading!
Tom


