Market Recap for Friday, March 18, 2016
The Russell 2000 ($RUT) gained 0.95% on Friday and easily outpaced our other major indices. It also closed back above 1100 for the first time since closing below that number on January 6th. Given the successful tests of the rising 20 day EMA throughout this rally, it's difficult to turn overly bearish until and unless that moving average is lost on a closing basis. But while the absolute performance of small caps is encouraging, its relative strength vs. the benchmark S&P 500 remains a challenge. First, check out the recent strength on the daily chart:
 Since crossing above its 20 day EMA, the RUT has not closed beneath it. If you're bearish, there's little chance of an extended slump in small cap prices without a close beneath that key short-term moving average. Clearly, the near-term remains bullish. Longer-term, however, the overall relative weakness remains problematic and suggests the domestic economy is not performing nearly as well as the Fed would like. Small cap relative weakness paints a different picture as reflected below:
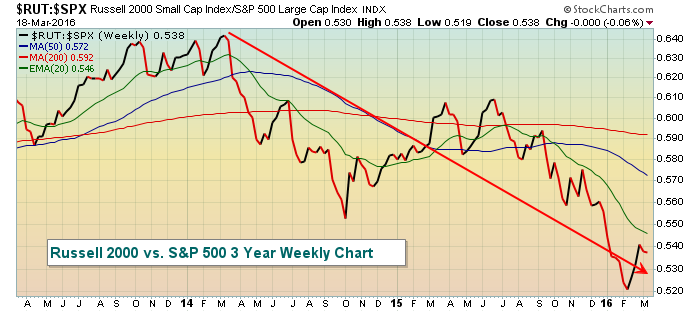 That long red arrow shows that small caps have been struggling on a relative basis for two years. While the bounce is nice and certainly needed, it appears to be nothing more than a dead cat relative bounce.
Healthcare (XLV) bounced back nicely on Friday as well after lagging badly earlier in the week. Keep in mind that the XLV is the worst performing sector over the current rally. However, most industry groups within healthcare have remained technically sound in the short-term. For instance, health care providers ($DJUSHP) surged 2.05%. The timing couldn't have been better as shown below:
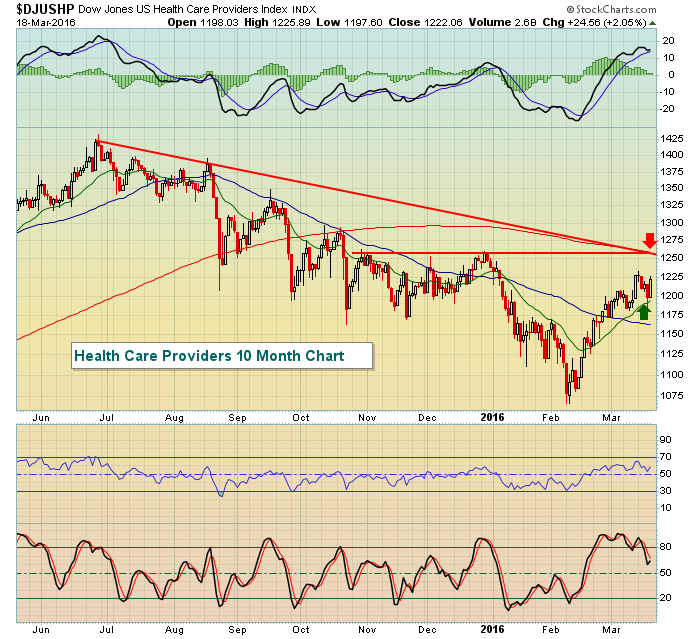 Both trendline and recent price resistance connect just above the 1250 level so that's the area where I'd expect sellers to become more aggressive. The rising 20 day EMA marks support. Therefore, the current trading range is squeezing on the DJUSHP and we'll soon find out which faction wins out.
Pre-Market Action
Outside of a few housing reports, there won't be much economic news to trade off of until later this week. GDP is due out on Friday morning and that will be closely watched. Earnings also will be light this week.
It was a mixed Asian market overnight. The best news was that the China Shanghai Composite ($SSEC) climbed back above the 3000 level for the first time since early 2016. The Hang Seng Index ($HSI) was flat, while the Tokyo Nikkei ($NIKK) fell more than 1%.
In Europe, action is more consistent and just turned negative with the key indices lower. That has put some pressure on U.S. futures as the indices here have also turned slightly lower.
Current Outlook
There are a number of mixed signals remaining in the U.S. stock market in terms of directional clues. As a result, I'm focusing on short-term indications. The week after quad witching day tends to move opposite the prior trend, which in the current case was higher. That means I'd look for short-term weakness. Keep an eye on the short-term price support levels identified below, although the 60 minute MACD shows momentum accelerating in bullish fashion near-term. Take a look:
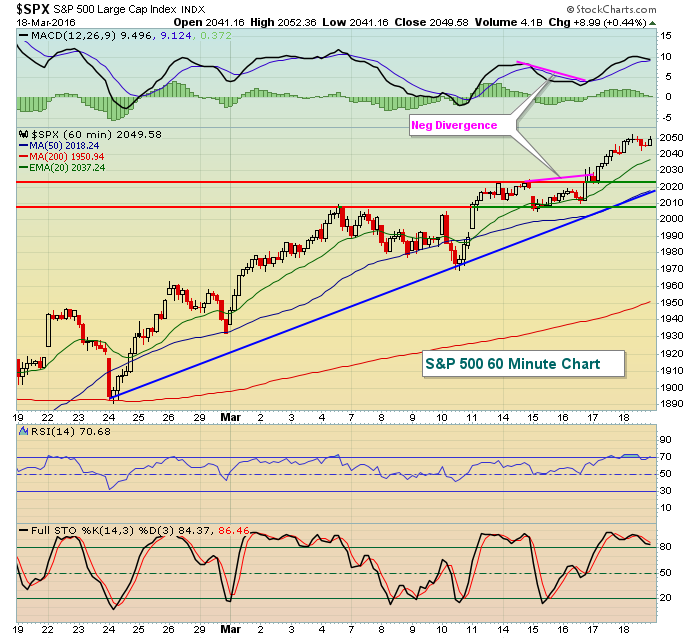 The three levels of support I'd watch are (1) 20 hour EMA, currently at 2037, (2) price support near 2023, and (3) next price support closer to 2008. It's interesting to note that the last breakout occurred with a negative divergence, but we didn't see any selling thereafter. Remember that many initial breakouts occur with lower MACD readings. We need to give the rallies time to extend and, in doing so, many times the negative divergence is eliminated. A more powerful bearish signal is sent if there's a negative divergence and the breakout level fails to hold (ie, lost price support) OR a reversing candle prints to confirm a potential top based on the slowing momentum.
Sector/Industry Watch
I mentioned health care providers above, but below is the recent technical bounce in another healthcare industry group - the Dow Jones U.S. Medical Equipment Index ($DJUSAM):
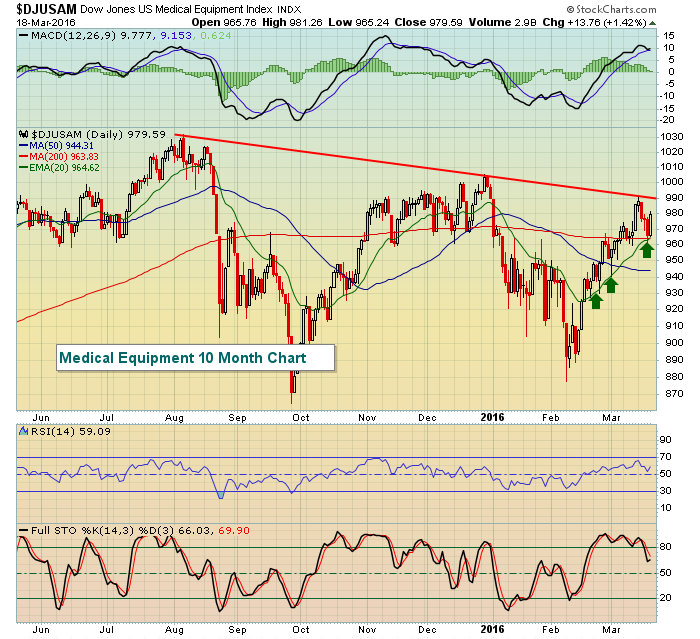 Trendline resistance marks a potential near-term top while the rising 20 day EMA marks solid short-term support. Let's watch that trading range and see which way this group breaks.
Historical Tendencies
April marks the third month in a four consecutive month period where the Russell 2000 has produced double digit annualized returns since 1988. But after strength the first two calendar days of the month, it uncharacteristically struggles from the 3rd through the 14th, posting negative annualized returns of 20.92% over the past 27 years. The second half of April is unusually strong and I'll post more on that bullish period in April.
Key Earnings Reports
(reports after close, estimate provided):
PBR: (.08)
Key Economic Reports
February existing home sales to be released at 10:00am EST: 5,305,000 (estimate)
Happy trading!
Tom


