Market Recap for Monday, March 21, 2016
It was another day of mostly higher prices, albeit gains were modest. That's the hallmark of a bull market - day after day of almost boring gains where bears cannot gain any traction whatsoever. If there's one thing that can change the trend, it's a suddenly-rising VIX. That's the objective of those who are bearish - to find something that can create nervousness and eventually panic. It's simply not there right now.
From a sector perspective, it was a mixed market with industrials (XLI) leading the action. The XLI has broken out to multi-month highs, but still must negotiate the all-time highs set a little more than a year ago. Still, the current pattern is undeniably bullish in my view. Check it out:
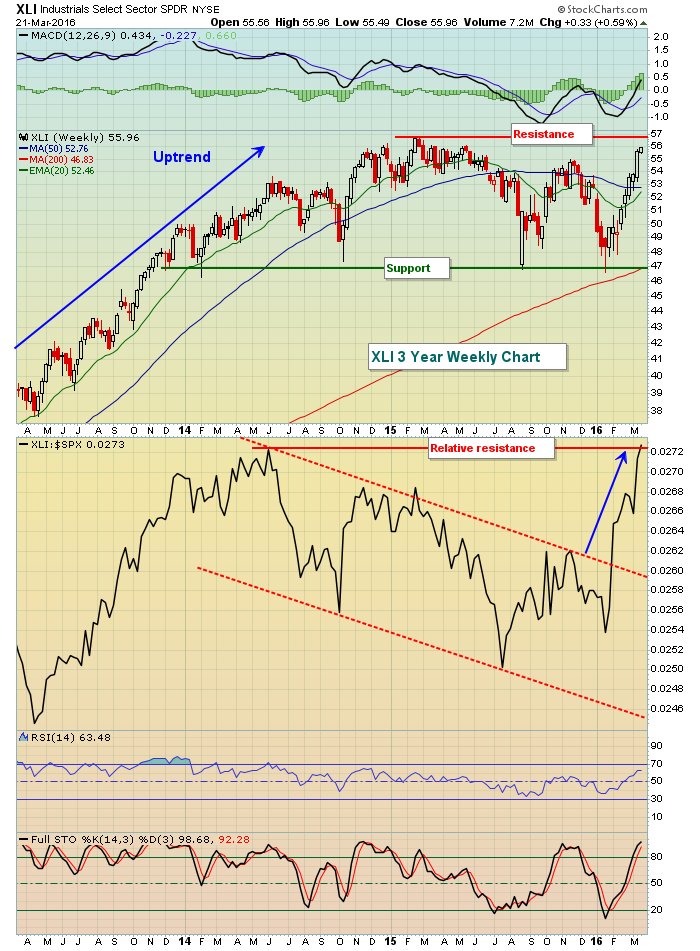 Support near 47 has held a handful of times and now it's the bulls' turn to challenge resistance. The relative strength of industrials is quite apparent from the above. Money has rotated to this sector since July 2015, breaking the down channel that was in play for nearly two years. Now this is a group in favor.
Consumer discretionary (XLY) was flat, but one of its leading industries - footwear ($DJUSFT) - broke out in bullish fashion above neckline resistance in an inverse head & shoulders pattern. Take a look:
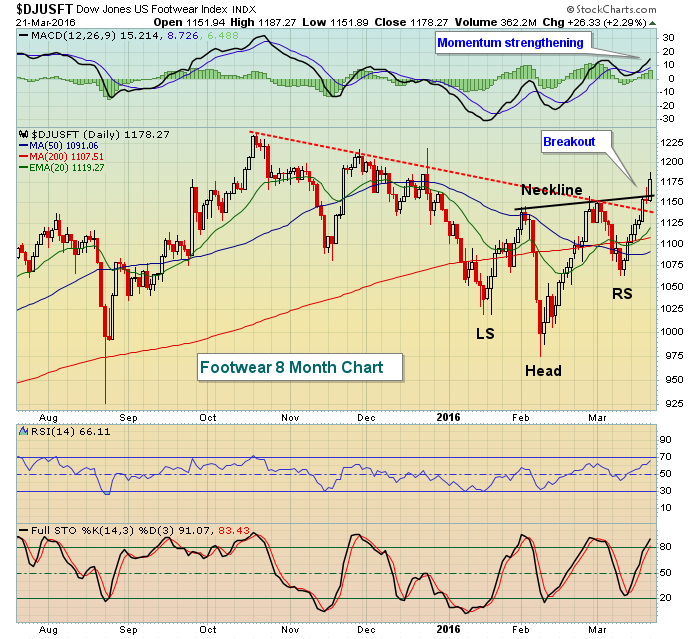 There was also a bullish downtrend line break on the DJUSFT as well.
Another industry group in the consumer discretionary space - broadline retail ($DJUSRB) - avoided short-term disaster with an afternoon recovery that featured a save of its rising 20 day EMA. It will be interesting to see if the group that includes Amazon.com (AMZN) can rebound in the coming days to challenge recent price highs. Here's the chart:
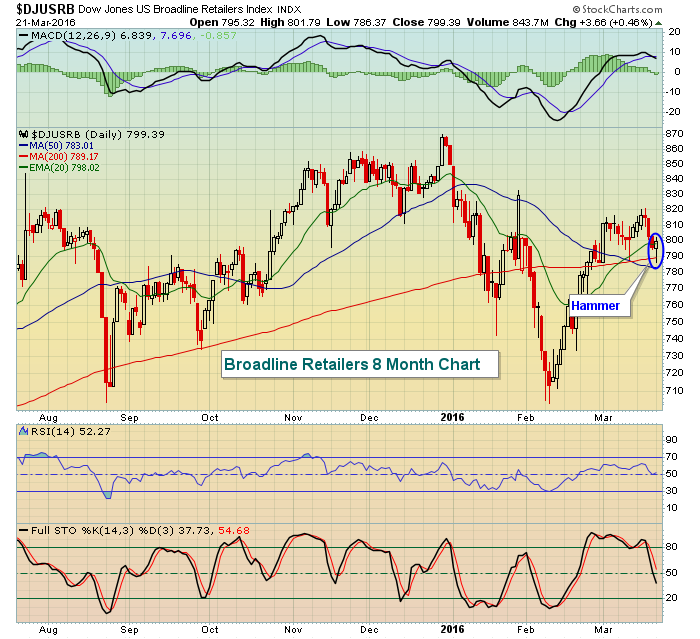 Yesterday's hammer occurred at the rising 20 day EMA, with the close just above that key short-term moving average.
Pre-Market Action
Explosions at the Brussels airport and metro system have taken a toll on U.S. futures this morning, following the lead of European indices. Losses across the pond are fractional, however, and early indications are that the U.S. will open with fractional losses as well. Technical conditions in major indices here can allow for short-term weakness and still remain bullish. Because there's been so much strength during this rally, the initial key support will be those rising 20 day EMAs. On the S&P 500, that level is currently 1996 so there's 2-3% of room to the downside before the bulls should be concerned.
The 10 year treasury yield ($TNX) has fallen back to test the 1.90% support level. The recent range from 1.90% to 2.00% appears to be a key pivot area. Further deterioration in the yield suggests rotation towards treasuries (safety), a warning sign for equity traders.
Current Outlook
Consumer spending is a big part of our economy and we'll get the latest glimpse of GDP on Friday morning. We're also in the middle of a few key economic reports surrounding the housing space. The 10 year treasury yield ($TNX) is closely tied to mortgage rates so it will be important to follow the technical conditions of the TNX as we evaluate the probability of higher prices in home construction ($DJUSHB). The TNX continues to hover in a key 1.90%-2.00% range, not really providing us any clues. Here's a chart to watch on home construction:
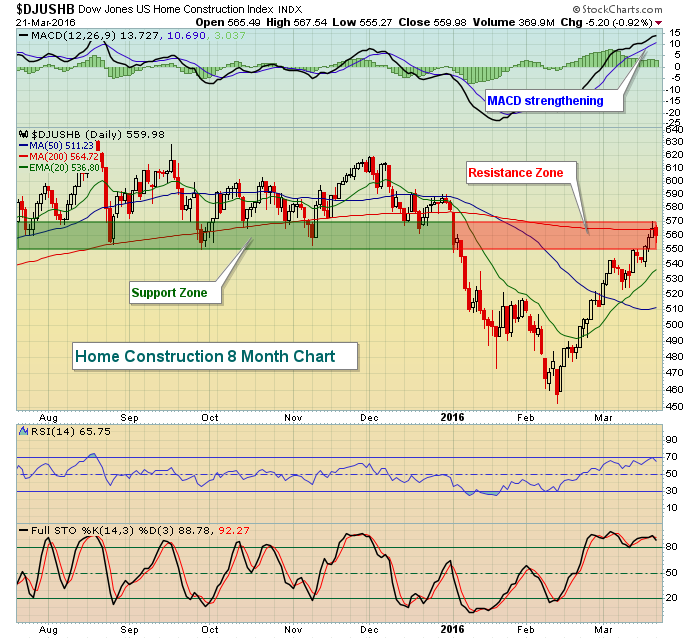 The good news is that momentum is strengthening in the short-term so watch the rising 20 day EMA for support during any bouts of selling. The problem, like we're seeing in many areas of the market, is that overhead price resistance remains. A breakout above that resistance zone would add further bullishness to a market that seems to want higher prices.
Sector/Industry Watch
Banks ($DJUSBK) are an important indicator of what to expect moving forward so I want to highlight the current perilous technical conditions in this group. First, let's look at the bullish short-term picture:
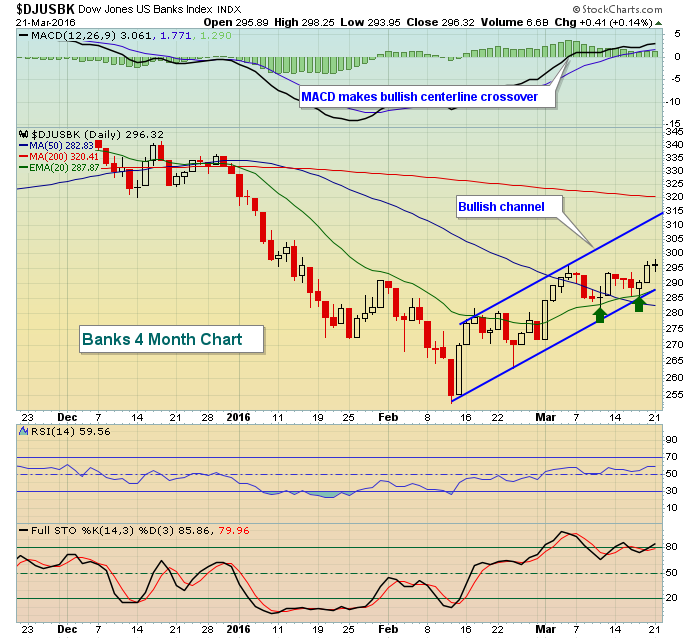 Prices certainly appear to be trending higher and key support levels are holding - for now. The problem continues to be the longer-term price resistance zone that banks are fighting. Here's the longer-term outlook:
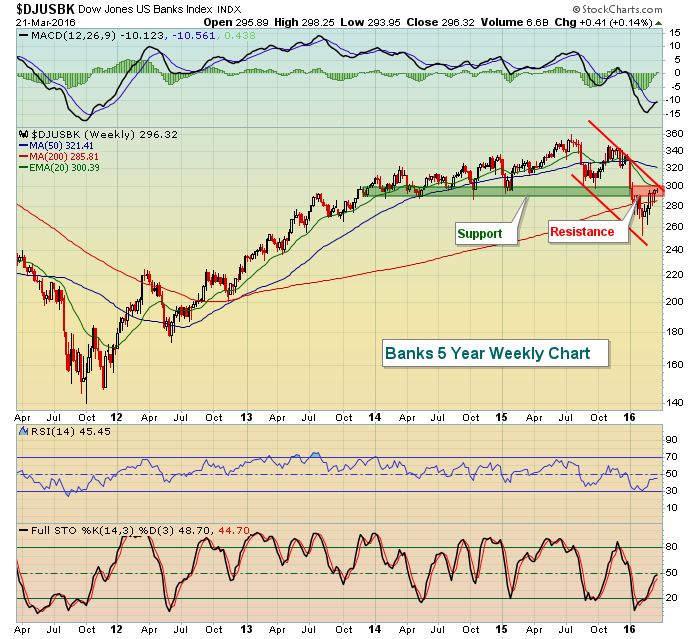 There are three problems that banks face on this longer-term chart. First, the falling 20 week EMA is currently at 300 and with a very weak MACD, that moving average is critical. Second, price resistance for years resided from 290-300. That range of support was lost in early 2016 and now we're testing that price resistance from underneath. Finally, a down channel has been established over the past several months and the upper downtrend line is being tested in addition to the price and moving average resistance. A breakout in the DJUSBK would put a major damper on the bear market theories.
Historical Tendencies
Since 1971 on the NASDAQ, Mondays and Tuesdays have both posted negative annualized returns (-30% on Mondays) while we've seen considerable historical strength on Wednesdays, Thursdays and Fridays. Wednesday truly has been "hump day" for stock market bulls for over four decades.
Key Earnings Report
(reports after close, estimate provided):
AIR: .27
CTAS: .95
NKE: .48
RHT: .31
Key Economic Report
January FHFA house price index to be released at 9:00am EST: +0.6% (estimate)
March PMI manufacturing index to be released at 9:45am EST: 52.4 (estimate)
Happy trading!
Tom


