Market Recap for Tuesday, March 8, 2016
Investors and traders turned to treasuries (TLT) and utilities (XLU) on Tuesday as money rotated back toward defense. The rally off the February 11th low has been characterized by rotation away from defense. It's not unusual to see selling accompanied by defensive rotation, so it'll be much more important to see how money rotates during the next rally - should one develop. Do traders again become aggressive? If so, the bulls are likely to have much more to celebrate.
The bond market can provide clues as to stock market performance. After all, if a dollar goes into bonds, that's a dollar that can't find its way into equities. So it's usually a good idea to follow the technical action in treasuries. The 20 year treasury bond fund (TLT) remains in a bullish wedge pattern, but is currently testing trendline resistance. If you're bullish equities, failure at this trendline is what you're looking for. Check out the pattern:
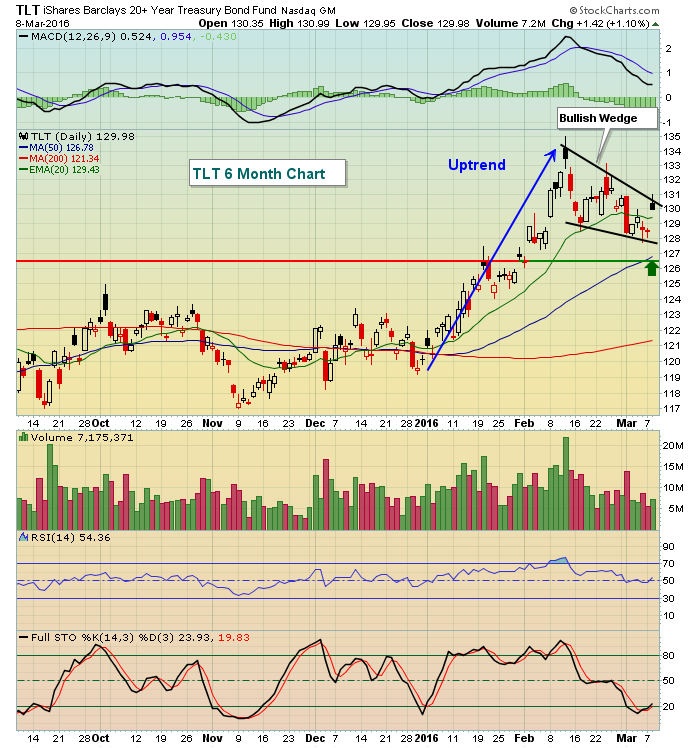 Given that utilities have already broken out to fresh highs, a bullish breakout in the TLT would be further indication of traders' preference for defense and safety, normally not the type of environment for equities to flourish. Of course, anything can happen, but technical indications and sector rotation help to provide us probabilities.
Energy (XLE) endured the majority of the selling on Tuesday as the sector tumbled 4.20%, but the XLE is in a technically-favorable position for the selling for the first time in many months. If you recall, 58.26 marked key price resistance until it was broken earlier this month on increasing volume. Now 58.26 marks support (price), along with the rising 20 day EMA, currently at 58.21. Here's a look:
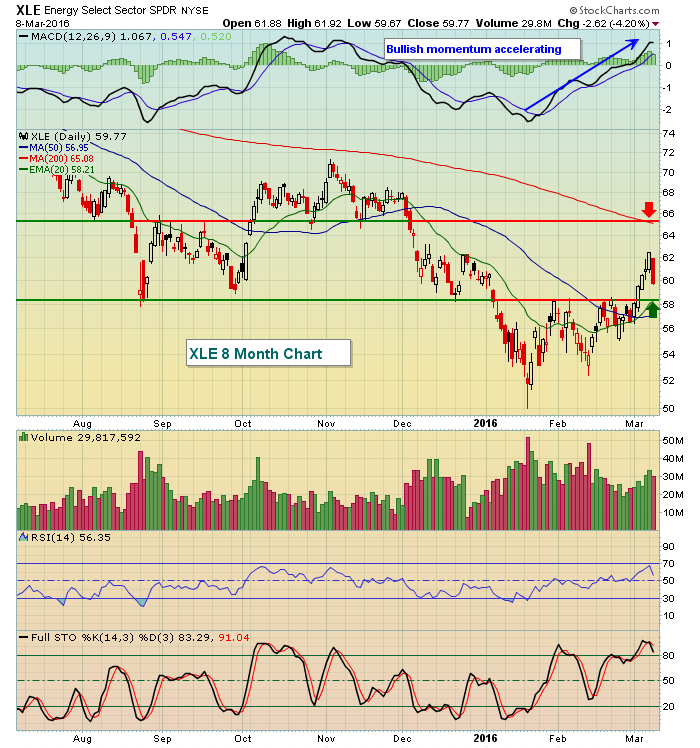 That was a big red candle yesterday, but the finish was well above 58.26 support. If you feel the XLE has bottomed, entry near that 58.26 level represents a solid reward to risk entry point. There's a positive divergence on the weekly chart (not shown) that suggests the XLE could move to the upper end of the trading range reflected above (red arrow marks next resistance).
Pre-Market Action
There was weakness overnight in Asian markets, but nothing terrible. In the meantime, we know there's a fairly tight positive correlation between the S&P 500 and German DAX ($DAX) and the rally in the DAX has carried it to a critical level on the weekly chart. Check it out:
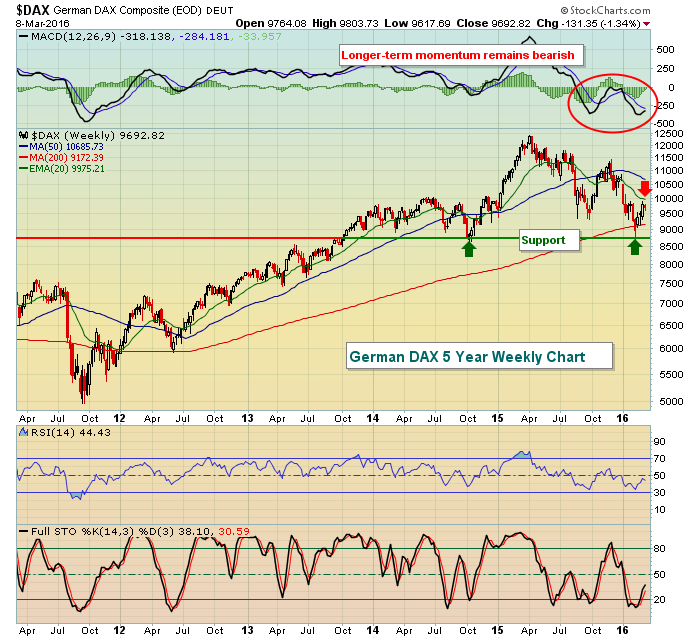 The January and March rallies have both fallen just shy of 10000 and that's exactly where the declining 20 week EMA resides. Therefore, a break above 10000 would likely be a bullish development for the benchmark S&P 500 as well.
This morning, treasuries are under pressure with the 10 year treasury yield ($TNX) rising to 1.88% after holding on to its key rising 20 day EMA on Tuesday. Currently, the TNX is trapped between 1.80%-1.90%. A break above would provide the bulls a lift while failure to hold 1.80% would perhaps signal the selling of equities ahead.
Current Outlook
An initial attempt to clear key price resistance failed. The levels I'd watch on the S&P 500 and NASDAQ continue to be 1995 and 4736, respectively. Here are the charts:
S&P 500:
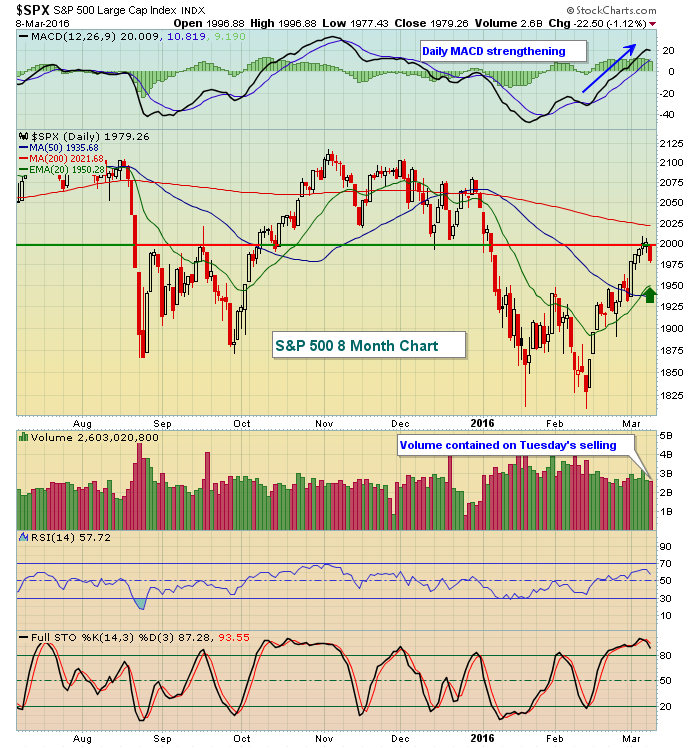 For two days, the S&P 500 threatened a breakout, actually closing above the 1995 level. But it was hardly a confirming type move and yesterday's selling quickly lost that level. The good news? The daily MACD shows solid bullish momentum on this push higher and the rising 20 day EMA is holding as support thus far. Also, volume on the drop Tuesday was less than average. Now a look at the NASDAQ:
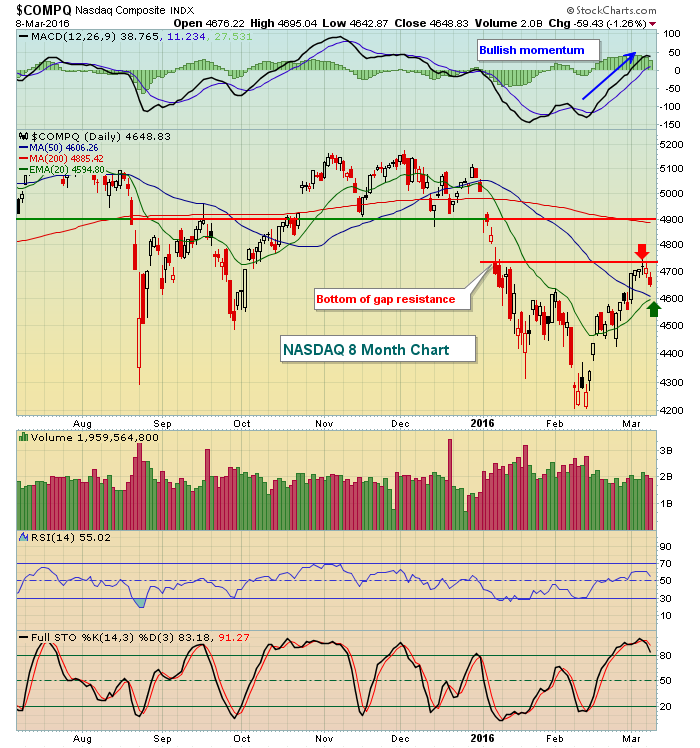 This is much more classic of a failure - so far. RSI 60 marked a top at major gap resistance. You can see the failure at gap resistance (red arrow) after an intraday breakout. The NASDAQ is now rolling over at a level we could have and should have expected. This doesn't mean the rally has ended. It simply indicates that sellers showed up to the party on time. The exciting part from a bullish perspective is that if 4736 gap resistance can be cleared, the next significant price resistance is at 4900 and that rally could be very quick and powerful. The bears, on the other hand, want that rising 20 day EMA (green arrow) to fail to hold as support with a surge in volume. A big red filled candle to break that moving average support would be just what the doctor ordered.
Sector/Industry Watch
The NASDAQ is home to many of our big name, large cap technology and consumer discretionary stocks so it's important for this index to lead during a bull market. However, the weekly chart below shows anything but strength and leadership. The daily chart of the S&P 500 and NASDAQ above provide much hope to the bullish argument. The weekly chart of the NASDAQ? Not so much. Check it out:
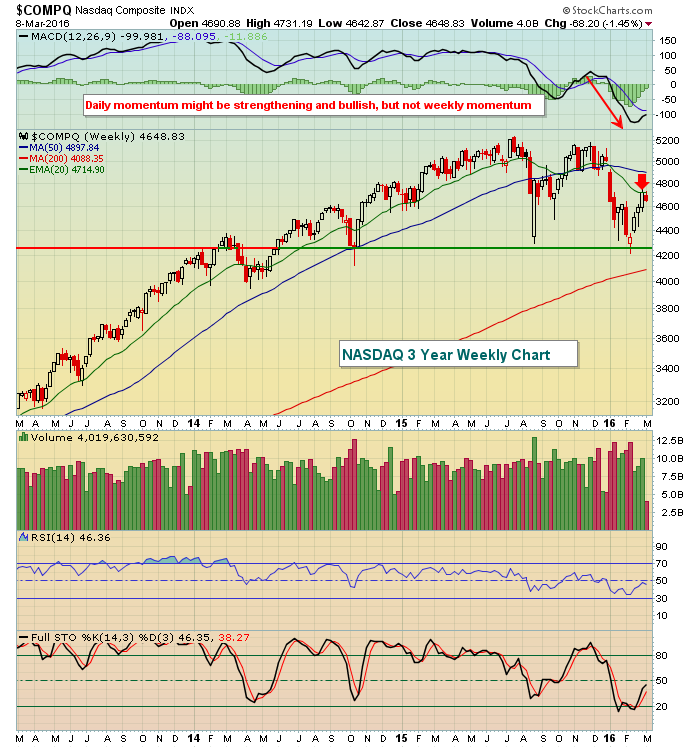 With a very weak MACD pointing straight down at the most recent low, rallies to test declining 20 week EMAs (red arrow) are generally an important test of the downtrend. Thus far, sellers have reappeared and a test of the prior low is likely. It's interesting how two charts of the same index can suggest completely different outcomes. For me, the longer-term charts trump the shorter-term charts and that's one reason why I still remain in the bearish camp.
Historical Tendencies
Since 1950 on the S&P 500, the odds of a Monday or Tuesday finishing higher is roughly 50% while Wednesdays through Fridays provide a 55% chance of a higher close. From an annualized return perspective, Wednesdays are the best day of the calendar week as they've produced nearly 20% returns over the last 65 years, more than double the S&P 500's average annual return of approximately 9%.
Key Earnings Reports
(actual vs. estimate):
KFY: .52 vs .51
Key Economic Reports
January wholesale trade to be released at 10:00am EST: -0.1% (estimate)
Happy trading!
Tom


