Market Recap for Wednesday, March 9, 2016
Energy (XLE) was back in the driver's seat on Wednesday as the XLE climbed 1.62% to easily outperform the other eight sectors. Weakness in the dollar (UUP) has contributed to recent strength in commodities and after an early gap higher in the dollar, the greenback retreated and enabled both energy and materials (XLB) to lead the action. The XLB appears to be printing a potential reverse head & shoulders bottom as reflected below:
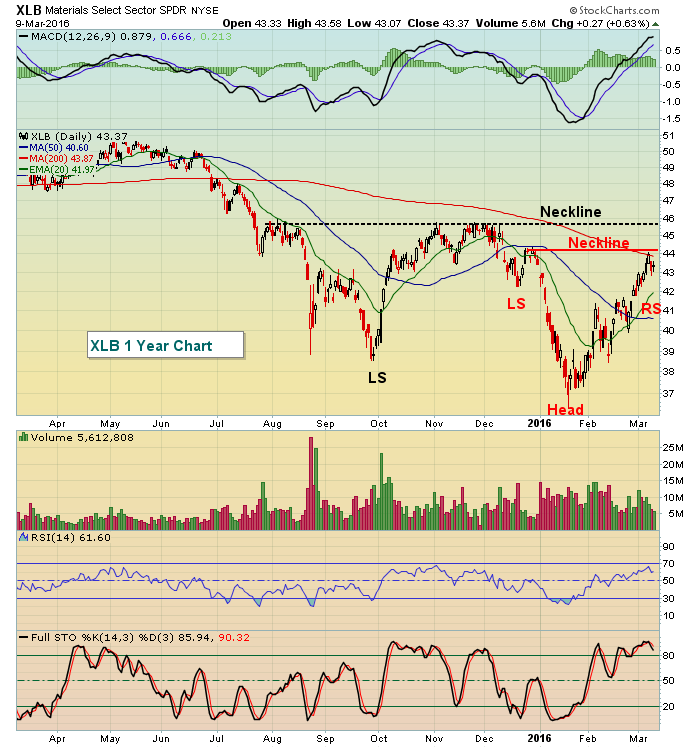 There are two possibilities of reverse head & shoulder bottoms. The short-term pattern is in red and the longer-term pattern is in black. I'm continuing to monitor both patterns as they have different measurements if the necklines are broken. And, of course, there's no guarantee either pattern will be confirmed.
Lagging the action was the financial sector, which was higher but only by 0.14%. Banks ($DJUSBK) have struggled since testing overhead price resistance and the DJUSBK is featured in the Current Outlook section below.
Pre-Market Action
The European Central Bank (ECB) has just announced more stimulus - additional quantitative easing (QE) and lower interest rates - and that has sparked a global equity rally. Gains in futures here in the U.S. just doubled (S&P 500 jumped from +9 to +19 shortly after the announcement). That news also has sent the 10 year treasury yield ($TNX) up to challenge 1.90% resistance again.
As mentioned below in the Historical Tendencies section, equities tend to perform bullishly in the middle of March and this certainly could be the catalyst to send equity prices higher. Prices will open higher, but how will they close? A big red filled candle at price resistance would be a disappointing failure, while a gap above with a hollow candle would be very bullish. Also, should equities rally, will this news send traders into aggressive areas of the market? We'll have to wait until later to find the answer, but early on it appears that market participants are excited by the prospects of more QE.
European markets have climbed considerably on the news with the German DAX ($DAX) on the doorstep of key price and psychological resistance near 10000. A breakout there would add to the bullishness here in the U.S.
Current Outlook
One area that we need to watch closely is the banking group ($DJUSBK). Few bull markets evolve with relative weakness in banks. The DJUSBK has tested key price resistance from 290-300 and has begun to pull back. Here's the chart:
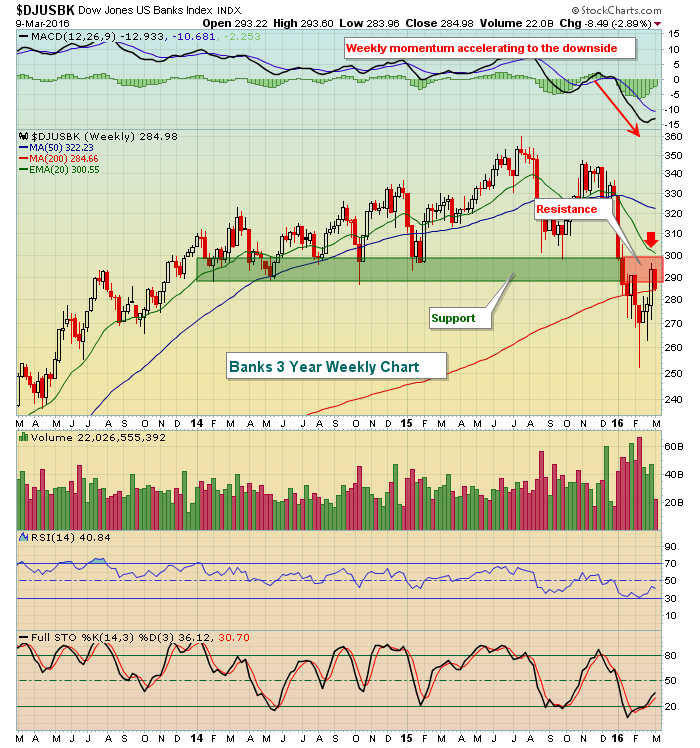 It's not just price resistance. You can see the declining 20 week EMA is at 300 as well. Not shown above is the rising 20 DAY EMA, which is currently positioned at 282. The bulls will be looking for that short-term moving average to hold as support while a breakdown there becomes a check mark on the bearish side of the ledger.
Sector/Industry Watch
The Dow Jones U.S. Computer Services Index ($DJUSDV) is stalling at key price resistance, but the good news is that it hasn't given up its recent gains. Here's the current outlook:
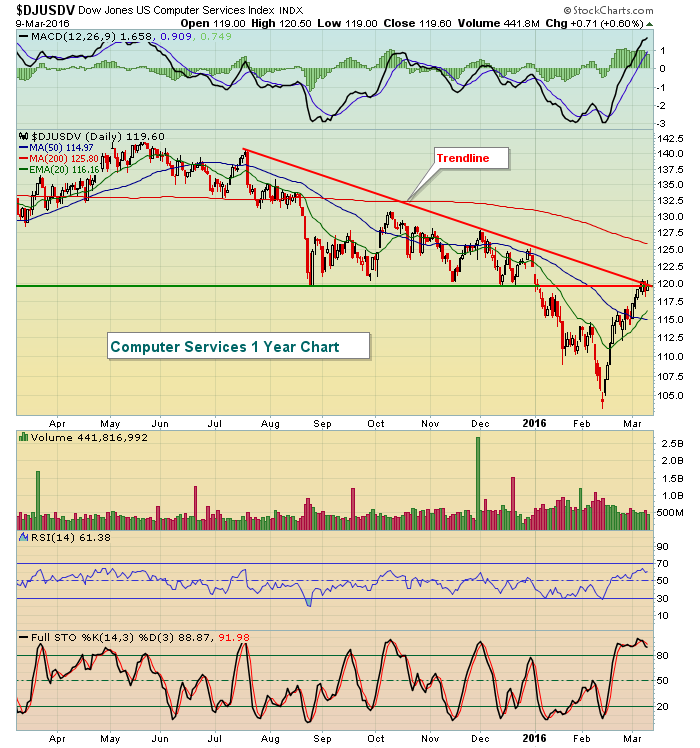 Both price resistance and trendline resistance intersect near the 120 level. A breakout would obviously be very bullish for this group.
Historical Tendencies
March 10th through March 18th represents a mildly bullish period for equities. The NASDAQ, for instance, has risen 59% of the days that fall during this period since 1971 and has produced annualized returns of 24.90%.
Key Earnings Reports
(actual vs. estimate):
DG: 1.30 vs 1.27
(reports after close, estimate provided):
PAY: .38
ULTA: 1.53
Key Economic Reports
Initial jobless claims released at 8:30am EST: 259,000 (actual) vs. 272,000 (estimate)
Happy trading!
Tom


