Market Recap for Friday, April 8, 2016
Our major indices gave up a big chunk of their earlier gains on Friday, but did manage to finish in positive territory. Crude oil ($WTIC) topped off a superb week (+8.27%) by rising 5.68% on Friday alone. The WTIC is now in a 35-42 price per barrel trading range. Breaking out above 42 would be bullish for the energy sector (XLE), which has risen 12.07% the past three months. Here's the latest look at crude oil:
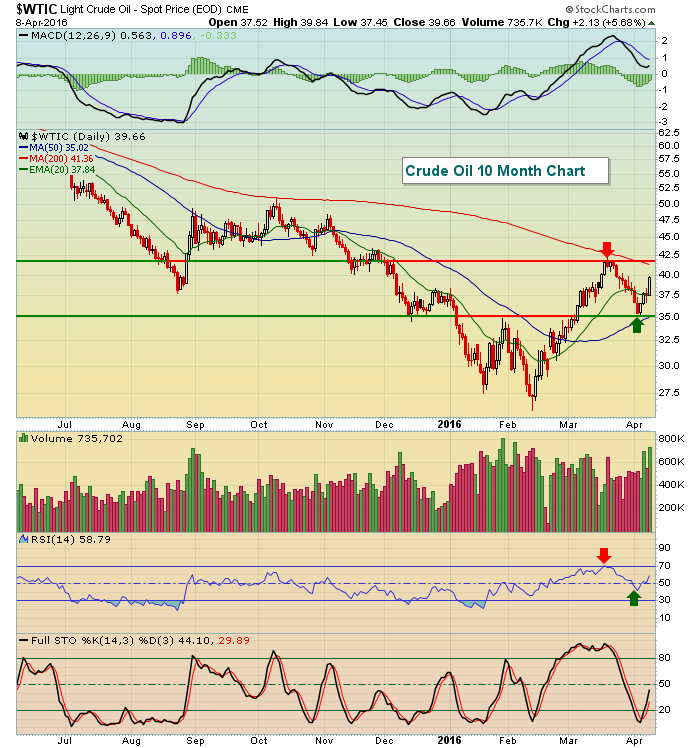 One interesting development has been the reaction in its momentum oscillators, especially its RSI. Over the past several months and throughout much of its downtrend, the RSI has struggled to clear 60, but routinely tested 30. Note that recently the WTIC has seen its RSI rise to 70 and so far hold 40 - indicative of much more bullish action within an uptrend.
Within the energy space, coal ($DJUSCL) has been the big winner in 2016, but keep in mind this is an extremely volatile group. Technically, I like what's been occurring in exploration and production ($DJUSOS). There are many hurdles left to clear, but the volume off the recent bottom smells like accumulation. Take a look:
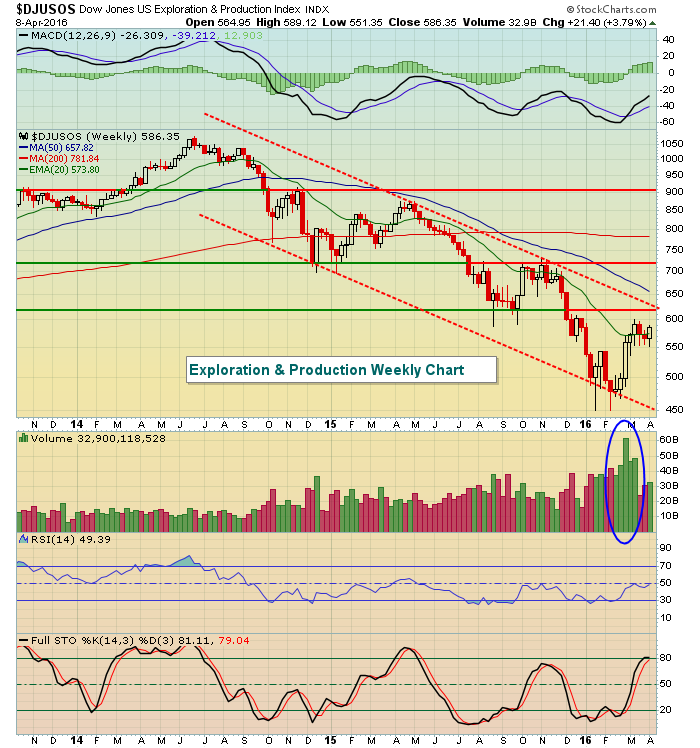 The heavy volume is very encouraging, but both downtrend resistance and price resistance reside just above the 600 level. Therefore, a weekly close back above 625 is needed to confirm a bottom. While our major indices have enjoyed a 7 year bull market and a debate continues as to whether we've entered a bear market or not, it's clear that exploration and production have been in a bear market for nearly two years. Putting it in perspective, the DJUSOS had fallen approximately 60% during its bear market, just as much as the S&P 500 did from 2007 to 2009. And we now know how much value was in the S&P 500 at that depressed level. Apparently, traders are moving into oil stocks in anticipation of a similar recovery.
While the energy trade worked beautifully throughout much of last week, the financial trade did not. The aggressive areas within financials performed very poorly last week, led by investment services, asset managers, banks, life insurance, etc. Investment services ($DJUSSB) fell a precipitous 6.00% in just one week. The DJUSSB is featured below in the Sector/Industry Watch section.
Pre-Market Action
Alcoa (AA) will kickoff the latest earnings season tonight after the bell. In pre-market action, however, there's been little earnings or economic news to speak of. Equity traders instead are looking to crude oil, action overseas and in the bond market.
Asian markets were mixed overnight, although China's Shanghai Composite ($SSEC) rallied 1.66%. In Europe, stocks were rallying after reports surfaced that Italian banks were meeting with Italian government officials and Bank of Italy executives to implement a fund to free lenders of non-performing loans. Sound familiar?
Finally, U.S. treasuries were selling, sending the yield higher this morning.
U.S. futures were higher to start the week as overseas developments helped to provide an early tail wind.
Current Outlook
The table has certainly turned. A year ago, it was the S&P 500 trying to push higher, but unable to mostly because crude oil and energy stocks could not catch a bid. Energy (and materials) truly held back nearly every rally attempt in the overall market because those two sectors were performing abysmally. This past week we saw several key areas of the market weakening, especially in financial areas, but our major indices did not lose key rising 20 day EMA support. The reason? Energy.
I believe energy has bottomed, but am waiting on further confirmation. One of those signals is a break of the XLE:$SPX relative downtrend. Check this out:
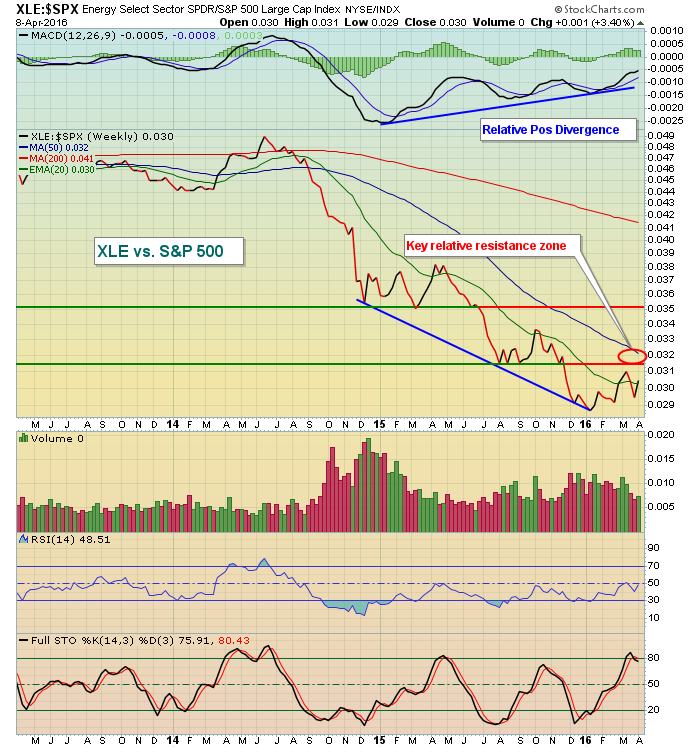 That red circle above highlights two key resistance levels - the first being relative price resistance. There was a triple bottom breakdown near .0314 that will need to be cleared. Second, the 50 day SMA is at .032 and declining. A positive divergence typically results in a 50 day SMA test. From there, I like to see what happens as we also typically see a MACD centerline test to coincide with the 50 day SMA test. Should both break to the upside, it would be further proof that energy has bottomed and likely has become a relative leader during the balance of 2016.
Sector/Industry Watch
Investment services ($DJUSSB) rolled over on their weekly chart after topping last summer and the weakness continues. The group rose nicely off its February low, but has tracked poorly relative to the S&P 500 and that relative weakness accelerated last as the DJUSSB failed at its declining 20 week EMA. Check it out:
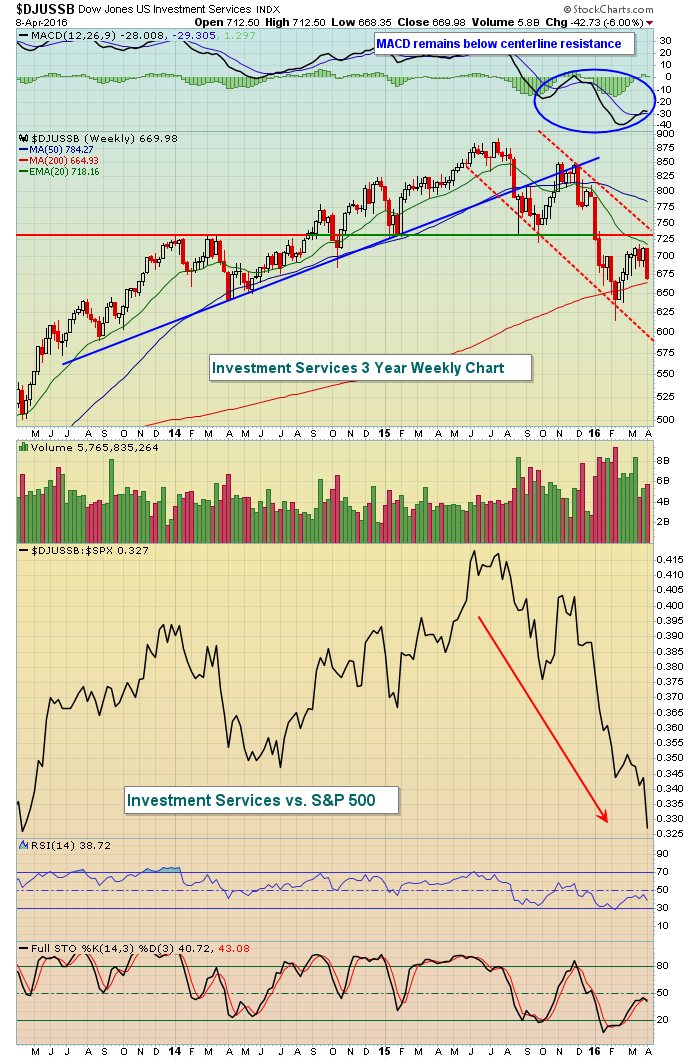 The DJUSSB has been an awful group to trade - at least from a long perspective as the relative weakness above shows quite clearly. And the response to the 20 day EMA test suggests we haven't seen a bottom in this group. I don't believe this space is worthy of an investment until we see both the 20 day EMA and downtrend line cleared - or until a positive divergence and reversing candle prints on this weekly chart.
Historical Tendencies
April is a solid month for the Russell 2000 (small caps), but the behavior during the month is odd. Typically, the first half of a calendar month produces better results than the second half. That's not the case for the Russell 2000 during April, however. Here are the annualized returns for each half of April on the Russell 2000 since 1987:
April 1-15: -4.79%
April 16-30: +35.87%
Key Earnings Reports
(reports after close, estimate provided):
AA: .02
OZRK: .54
Key Economic Reports
None
Happy trading!
Tom


