Market Recap for Monday, April 11, 2016
It was a disappointing day on Wall Street Monday as nice early gains vanished by the close with all of our major indices at the door step of 20 day EMA support. The Dow Jones was higher by 155 points 30 minutes into the trading session on Monday, then the selling kicked in and the Dow fell into negative territory late in the day. There was significant selling in aggressive areas of the market in the final hour as the following chart illustrates:
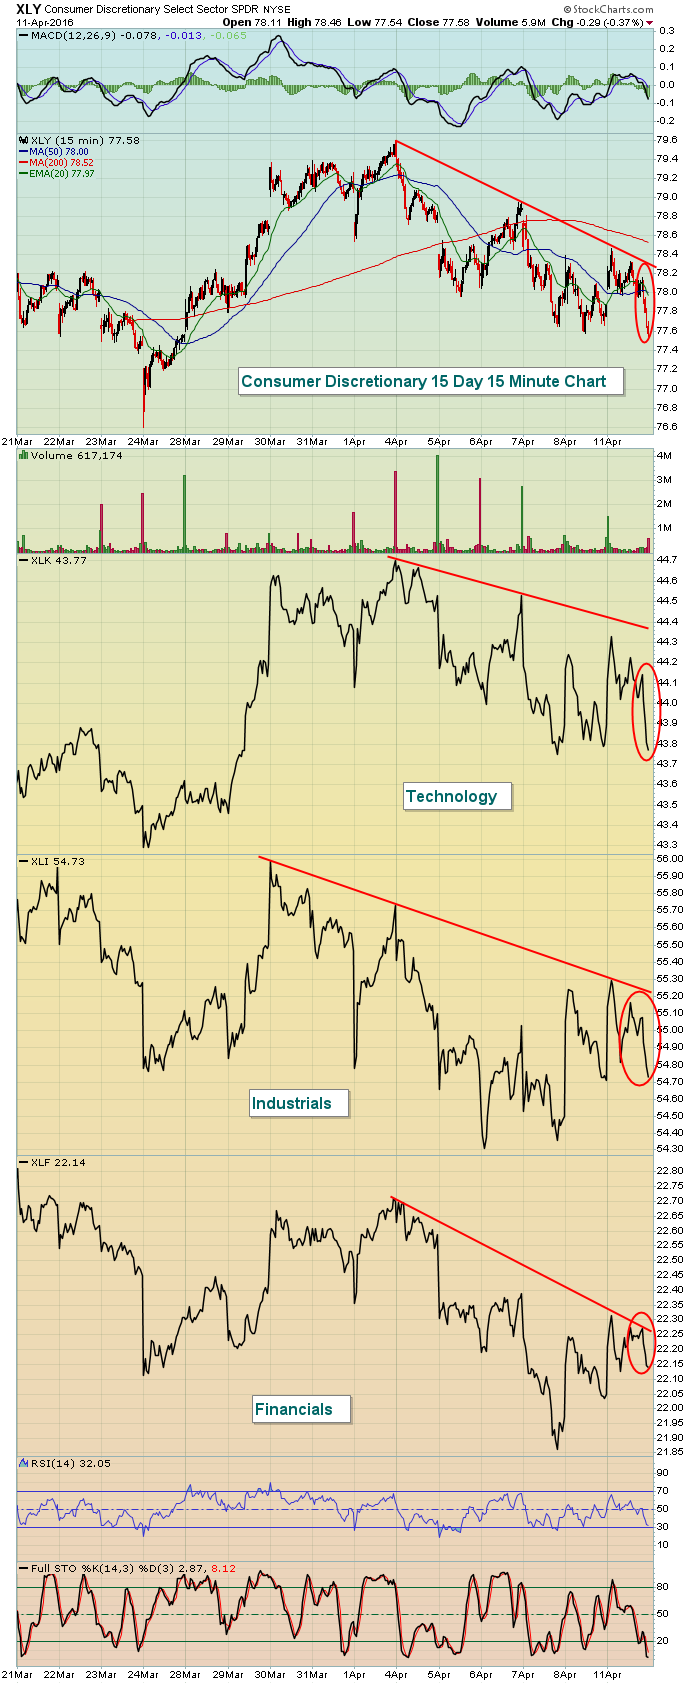 There are two common denominators here. First, all four of these aggressive sectors sold off in the final hour yesterday. Second, it's rather clear they've all been downtrending in April. But while the short-term chart remains challenging, key 20 day EMAs continue holding as support on the XLK and XLI. The XLY and XLF, however, have already closed beneath this key moving average.
While the above shows weakness yesterday among our most aggressive sectors, it was actually two defensive groups - healthcare (XLV) and consumer staples (XLP) - that led the market lower with losses of .76% and .71%, respectively.
The U.S. Dollar Index ($USD) closed at 93.94, its lowest close since October 14th's close at 93.96. The next chart shows that the USD is moving into a very important support zone.
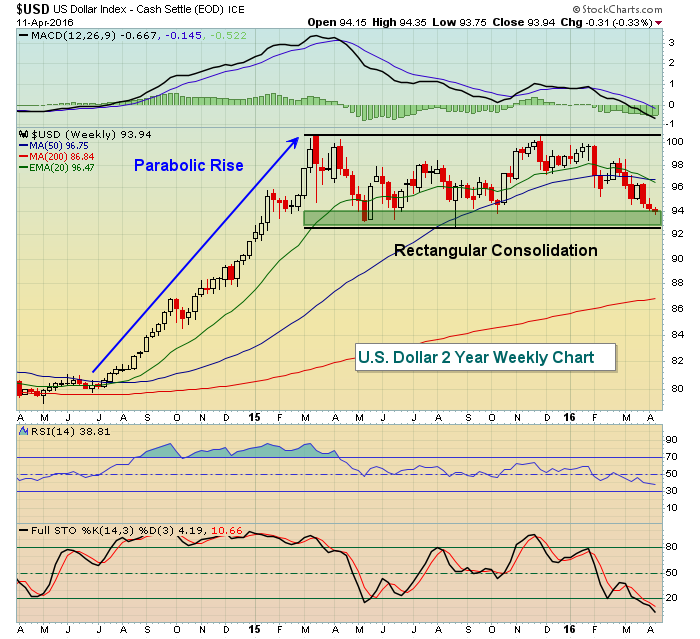 The selling of the dollar has been having very positive implications for commodities, particularly gold, which is being featured in the Sector/Industry Watch section below.
Pre-Market Action
Alcoa (AA) kicked off earnings season after the bell last night and their results were mixed. Revenues were down 15%, but EPS beat estimates. Investors were not thrilled as AA trades down 3% at last check in pre-market trading.
Crude oil ($WTIC) was trading higher this morning, aiding U.S. futures in an attempt to reverse the selling that took place on Monday. The problem in the stock market recently, though, hasn't been at the open or in the first 30 minutes of trading. It's been the balance of the trading day and we were reminded of that once again yesterday.
Asian markets were mixed overnight with strength in Tokyo's Nikkei ($NIKK). In Europe this morning, the major indices are clinging to fractional gains.
The 10 year treasury yield ($TNX) is up to 1.75% in early trade.
Current Outlook
Here's the latest look at the S&P 500 daily chart:
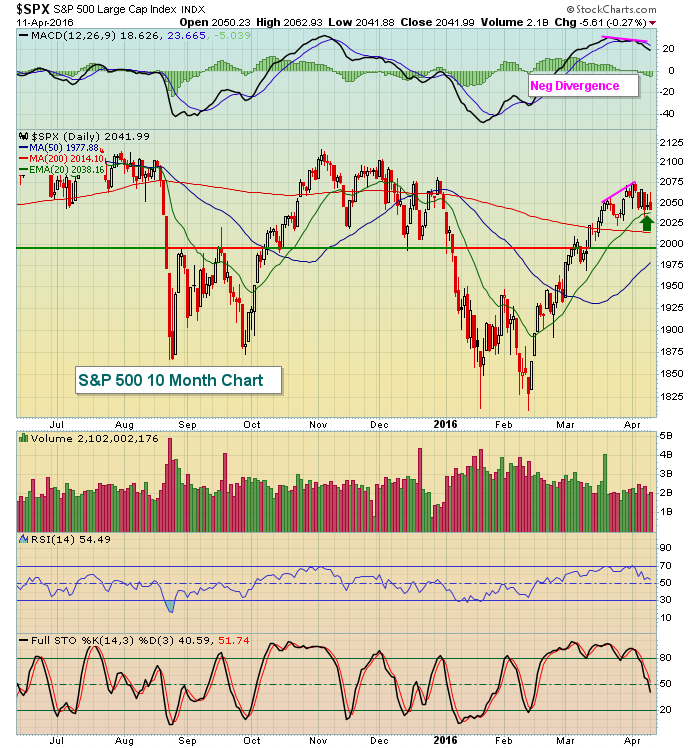 There's a negative divergence on the most recent price high and that could signal more volatility and weakness ahead. Loss of the rising 20 day EMA would likely trigger further selling and April 13th and 14th are notorious for selling as tax day (April 15th) approaches. Negative divergences often times see selling down to test 50 period SMAs as MACDs gravitate toward centerline tests. Note that the rising 50 day SMA is currently at 1978 and the 1995 level has been a key pivot area over the past several months as the horizontal line above reflects. Throw in the 2000 psychological level and that would seem a likely destination for equity prices should the 20 day EMA fail to hold.
Sector/Industry Watch
The weakening dollar (shown above) has been driving many investors/traders into gold ($GOLD). The two move inversely to one another as the following correlation indicator shows:
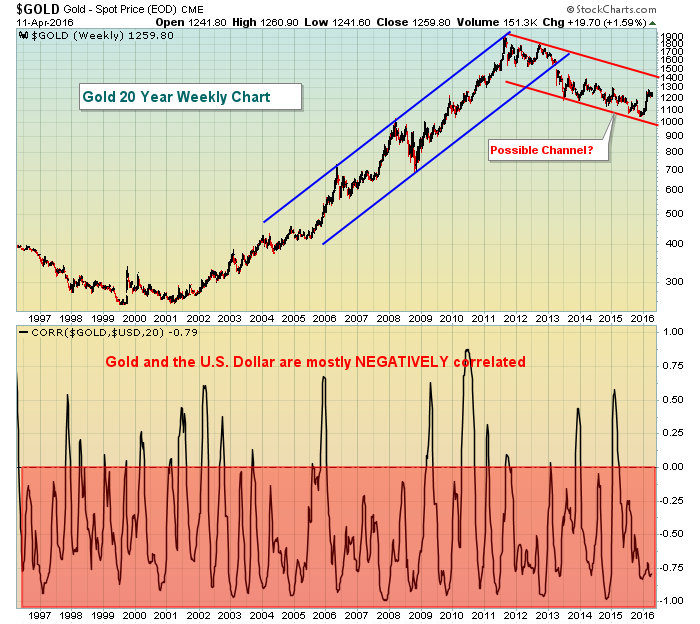 The red shaded area shows us that gold and the dollar tend to move in opposite directions. Currently, the dollar is in a bullish continuation pattern, but has been weak of late. Gold appears to be in a down channel, but has shown strength of late. The dollar's primary support is in the 92.50-94.00 zone. The levels I'd watch on gold are reflected on the following daily chart:
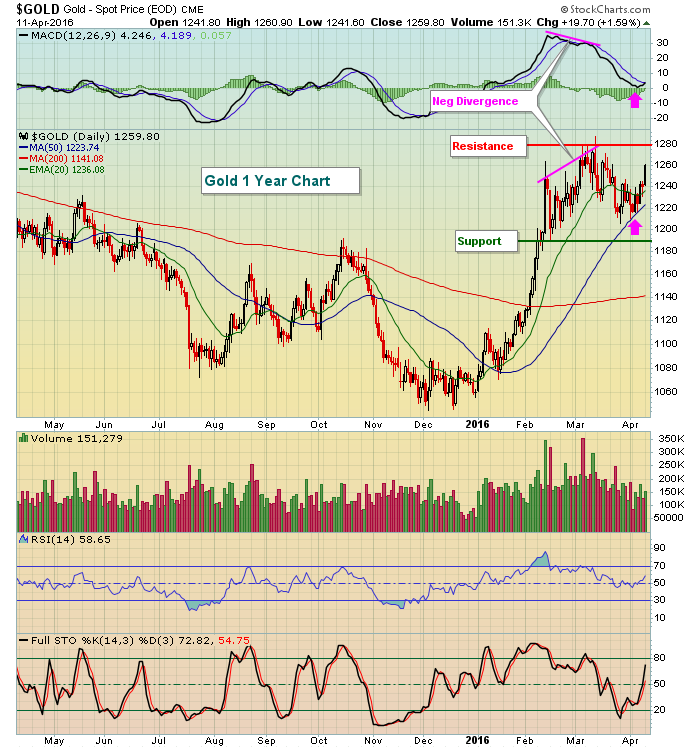 The recent negative divergence was a sign of slowing momentum and gold retreated to its 50 day SMA while its MACD hit centerline support (pink arrows). Since that time, gold has strengthened once again. In the near-term, I'd keep an eye on the 1190-1280 trading range. Given that the dollar's long-term pattern remains bullish and it's closing in on major price support, I'd opt for taking profits on gold as it nears 1280 and to watch to see if the dollar holds or breaks support as that will likely determine the longer-term direction of gold.
Historical Tendencies
There seems to be a tendency for the S&P 500 to sell off prior to the April 15th tax filing deadline for individuals in the U.S. April 13th and 14th have annualized returns of -35.73% and -8.93%, respectively, over the past 66 years. In 2015, however, there was little or no selling pressure prior to April 15th. In 2014, the primary selling occurred on April 10th and 11th. While the selling tends to vary by year, there does appear to be a trend worth paying attention to.
Since 1971, the selling on the NASDAQ on April 13th and 14th is more pronounced with annualized returns of -55.18% and -77.69%, respectively.
Key Earnings Reports
(actual vs. estimate):
FAST: .44 vs .44
(reports after close, estimate provided):
CSX: .37
Key Economic Reports
March import prices released at 8:30am EST: +0.2% (actual) vs. +1.0% (estimate)
March export prices released at 8:30am EST: +0.0% (actual) vs. +0.0% (estimate)
Happy trading!
Tom


