Market Recap for Thursday, March 31, 2016
Utilities (XLU) were the only sector to finish in positive territory on Thursday, rising .59%. The remaining eight sectors fell, led by materials' (XLB) .84% decline. While the loss on Thursday was a problem for the materials bulls, weakness in the U.S. dollar ($USD) has resumed with the USD closing at its lowest level since mid-October. That weakness comes amid a nice 2016 uptrend in the XLB that began January 20th. In other words, this bout of selling could be setting up entry on the long side. Take a look at the solid uptrend in play:
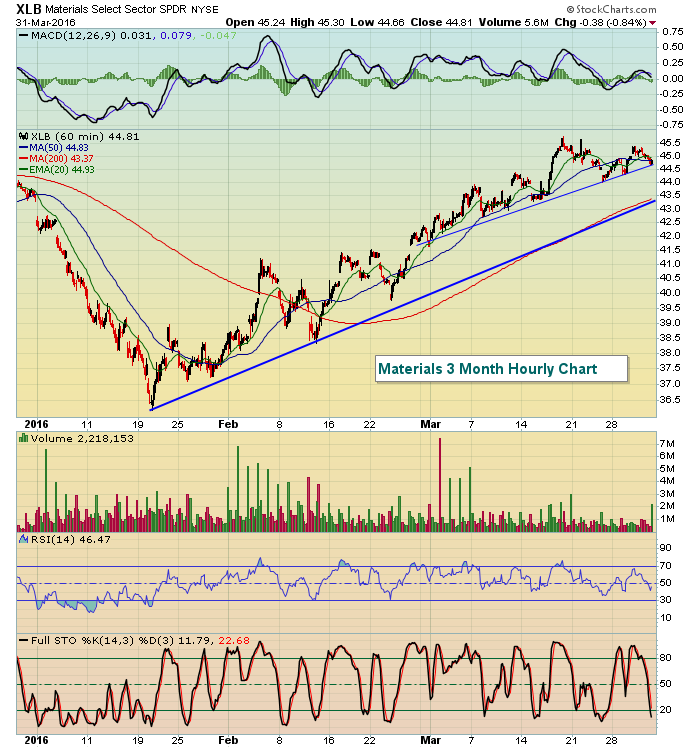 The thicker blue trendline reflects the uptrend in place since January 20th while the thinner blue trendline simply highlights the trend that's been in place throughout March. Breaking that shorter-term trendline would likely lead to a test of the longer-term trendline, which represents the best reward to risk entry in my view.
Among materials, silver ($SILVER) continues to struggle with overhead resistance near the 16.25 level. Check out the multiple failures at that level in the past several months and the issues that remain for silver bulls:
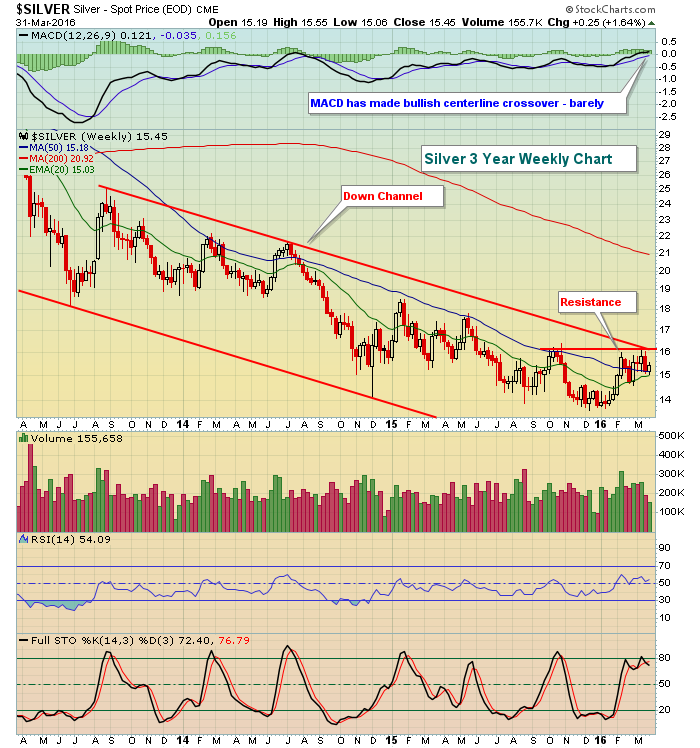 A breakout above 16.25 clears both short-term price resistance and the longer-term down channel trendline. Given that the weekly MACD has just broken above centerline resistance, a price breakout would be a bullish development for silver.
Pre-Market Action
Despite a slightly better-than-expected jobs report this morning, U.S. futures are lower, albeit off their lowest levels of the morning. If the current futures hold up, we'll likely see stocks open with perhaps a 0.3% decline.
With the report, treasuries initially sold off with the 10 year treasury yield ($TNX) moving up to 1.81%. The appetite for defensive treasuries has picked back up again, however, with the TNX setting another daily low at 1.78%. I will be watching the TNX closely. It has badly lagged the S&P 500 the past several trading sessions and needs to recover to provide more ammunition for equity bulls.
Current Outlook
Because the market will be reacting to a key economic report today, below I've highlighted a few critical short-term levels to watch on the S&P 500:
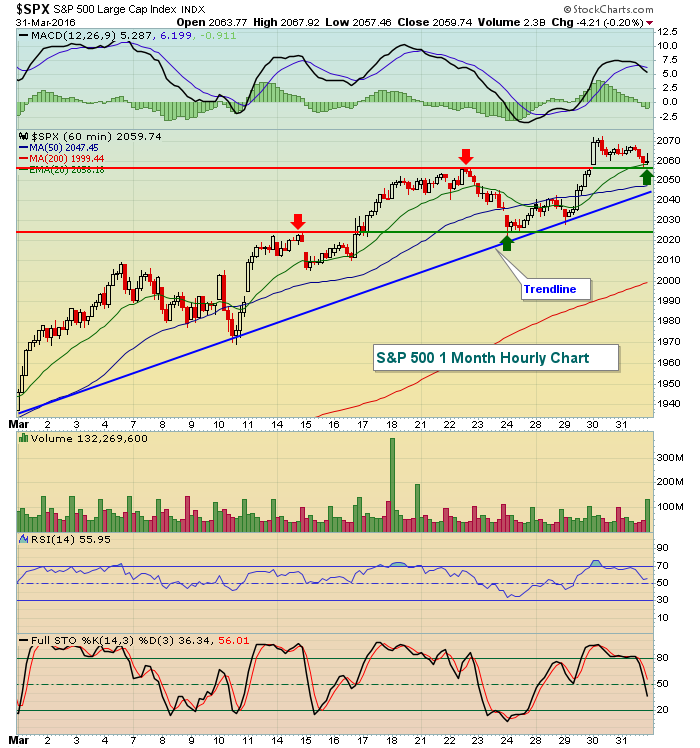 The upsloping blue line shows the nice uptrend that's been in play throughout March. The two horizontal lines mark short-term levels of price support/resistance. The initial level of price support near 2057 is likely to be lost at the open, but in the longer-term scheme of things, it's not really that big of a deal. An uptrend requires a series of higher highs and higher lows, though, so the second level of price support close to 2024 is much more significant. Not only does it mark price support on this hourly chart, but it also represents rising 20 day EMA support (not reflected above) on the daily chart. There is a very slight negative divergence on the daily MACD so a break below that rising 20 day EMA would be significant from a trading perspective.
Sector/Industry Watch
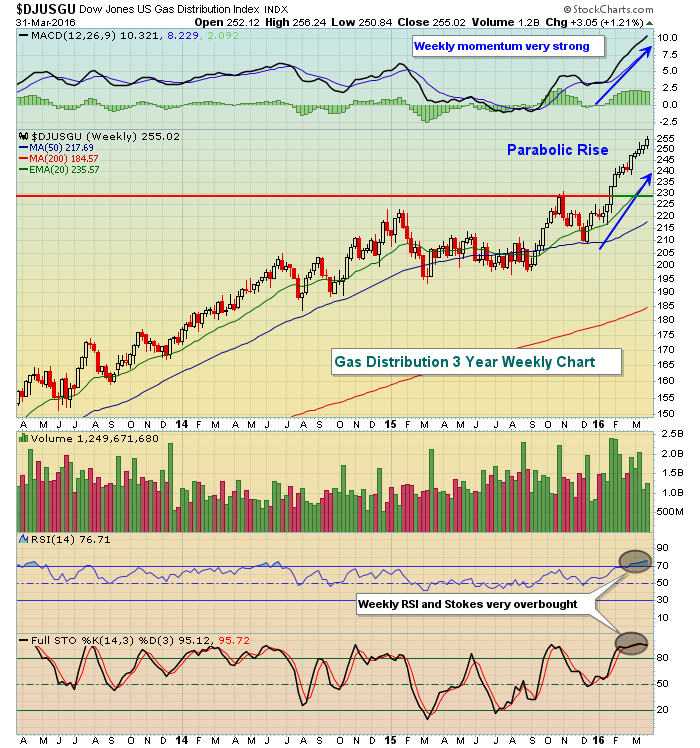
The best performing sector over the past three months has been utilities, gaining 15.51%. All five of its industry groups have gained at least 12.50% over that span with Gas Distribution ($DJUSGU) leading the charge. Here's the bullish weekly view of the DJUSGU, followed by the more cautious daily chart:
Long-term weekly:
 Now the intermediate-term daily chart:
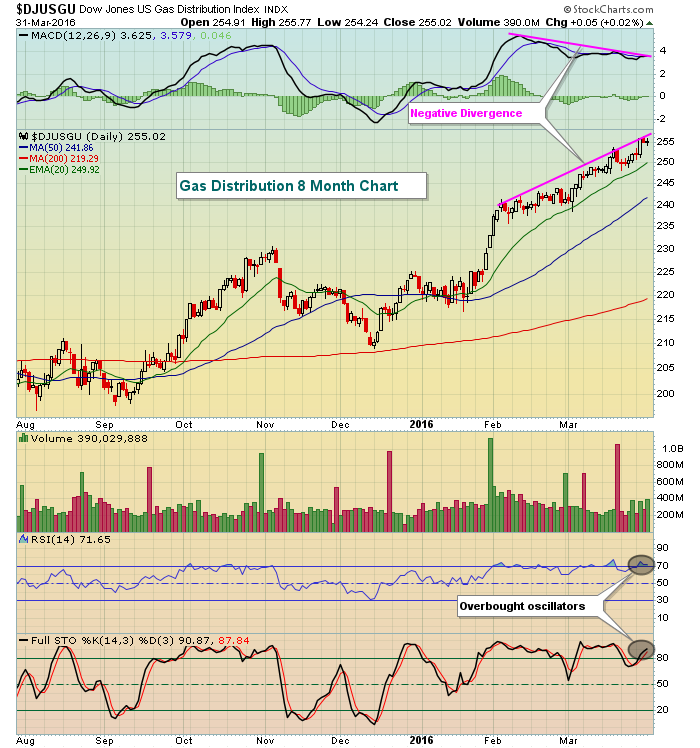 The DJUSGU is now overbought on both intermediate- and long-term time frames and a negative divergence has printed on the daily chart of the past several weeks. While this industry group may continue pushing higher, I believe the reward to risk is now strongly in favor of taking profits and awaiting a daily MACD centerline reset for re-entry.
Historical Tendencies
The first calendar day of the month has produced the largest annualized returns on the S&P 500 and NASDAQ. Here are the annualized returns for the first calendar day of the month for the S&P 500 (since 1950), NASDAQ (since 1971) and Russell 2000 (since 1987):
S&P 500: +46.93% (2nd best calendar day is the 2nd at 38.70%)
NASDAQ: +61.04% (2nd best calendar day is the 31st at 49.88%)
Russell 2000: +43.03%
The first calendar day of the month on the Russell 2000 actually ranks as the fourth best day. Here are the three calendar days that have fared better:
31st: +75.58%
16th: +63.03%
29th: +62.71%
Key Earnings Reports
(actual vs. estimate):
BBRY: (.03) vs (.08)
Key Economic Reports
March nonfarm payrolls released at 8:30am EST: 215,000 (actual) vs. 210,000 (estimate)
March private payrolls released at 8:30am EST: 195,000 (actual) vs. 200,000 (estimate)
March unemployment rate released at 8:30am EST: 5.0% (actual) vs. 4.9% (estimate)
March average hourly earnings released at 8:30am EST: +0.3% (actual) vs. +0.2% (estimate)
March average workweek released at 8:30am EST: 34.4 (actual) vs. 34.5 (estimate)
March PMI manufacturing to be released at 9:45am EST: 51.7 (estimate)
March ISM manufacturing to be released at 10:00am EST: 50.5 (estimate)
March consumer sentiment to be released at 10:00am EST: 90.9 (estimate)
February construction spending to be released at 10:00am EST: +0.2% (estimate)
Happy trading!
Tom


