Market Recap for Wednesday, March 30, 2016
U.S. equities jumped again, this time with most of the major indices climbing a similar percentage close to .50%. The Russell 2000 ($RUT) lagged a bit, but considering the huge outperformance on Tuesday, let's give the small caps a one day pass. The 2.67% gain on Tuesday provided the RUT its latest breakout and extended the rally that began on February 11th. Here's the chart:
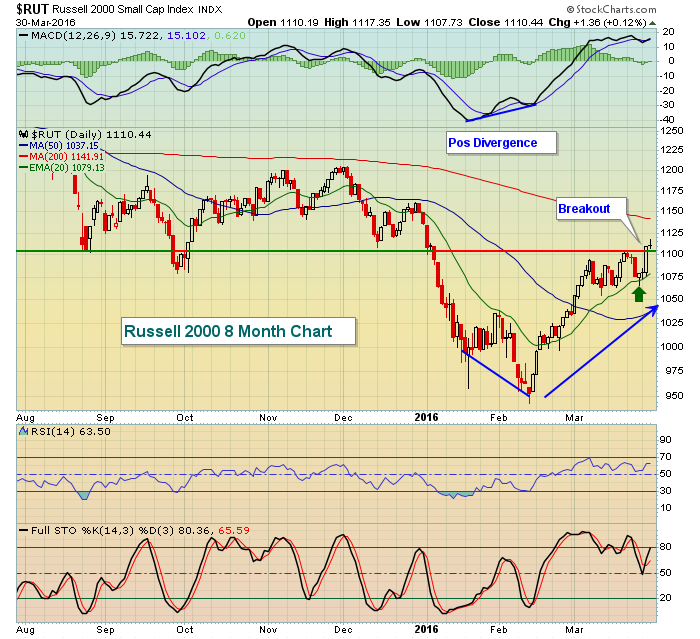 1100 has proven to be a significant level of both price support and resistance. Recently holding its rising 20 day EMA (green arrow) within an uptrend is a bullish development for the Russell 2000, especially given the latest price breakout. There are plenty of mixed signals with U.S. equities, but the current trend higher, so long as it holds, must be respected.
The two best performing sectors on Wednesday were consumer staples (XLP) and consumer discretionary (XLY), which gained .66% and .64%, respectively. Within staples, the Dow Jones U.S. Food Retailers & Wholesalers Index ($DJUSFD) made a break above the bottom of gap resistance yesterday, as reflected below:
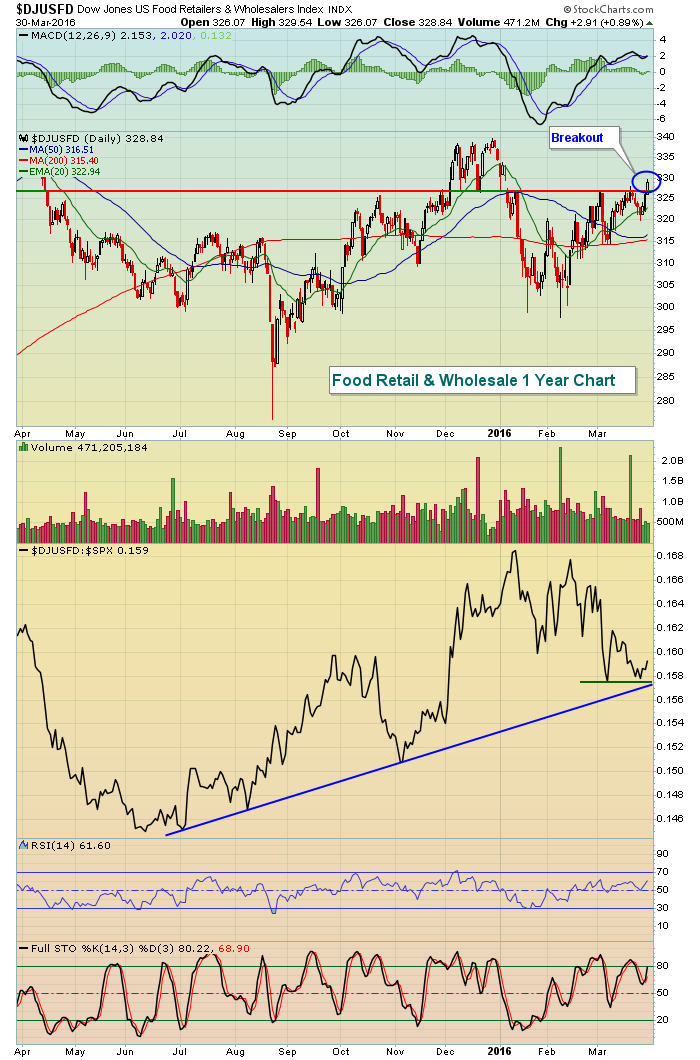 Toward the bottom of the above chart, you'll see the DJUSFD performance relative to the S&P 500. It's been relatively weak in 2016, but just approached a key relative uptrend line. So it would make sense to see money rotate into this industry group. The price breakout may be suggesting that rotation is now beginning. See the Sector/Industry Watch section below for a stock within this space that looks interesting based on Wednesday's action.
Pre-Market Action
U.S. futures have risen off earlier lows and are now situated very close to the flat line. The 10 year treasury yield ($TNX) has continued to decline in light of recent dovish remarks by Fed Chair Janet Yellen. The 1.90%-2.00% yield resistance zone has held thus far and now short-term yield support just above 1.80% is being tested. Check out the chart:
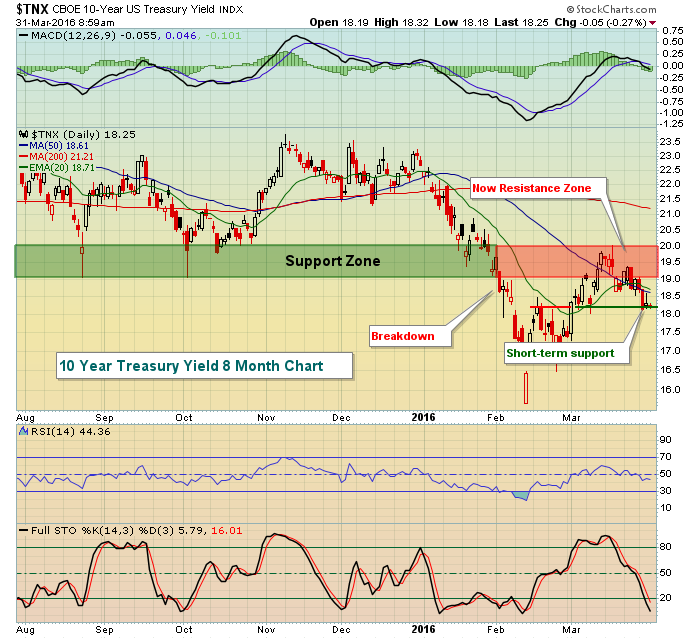 A breakdown in yield suggests more money is flowing toward defensive treasuries, a bearish sign for equities. If you're bullish equities, you really want to see the TNX reverse and begin to trend higher.
Current Outlook
The NASDAQ earlier this month tested key gap resistance at 4736.40. I mentioned at the time that a breakout above gap resistance would likely lead to a fairly quick test of price resistance near 4900. Yesterday's intraday high was 4899.14. Close enough. One look at the following chart and I think it's pretty clear the significance of this pivot level. Take a look:
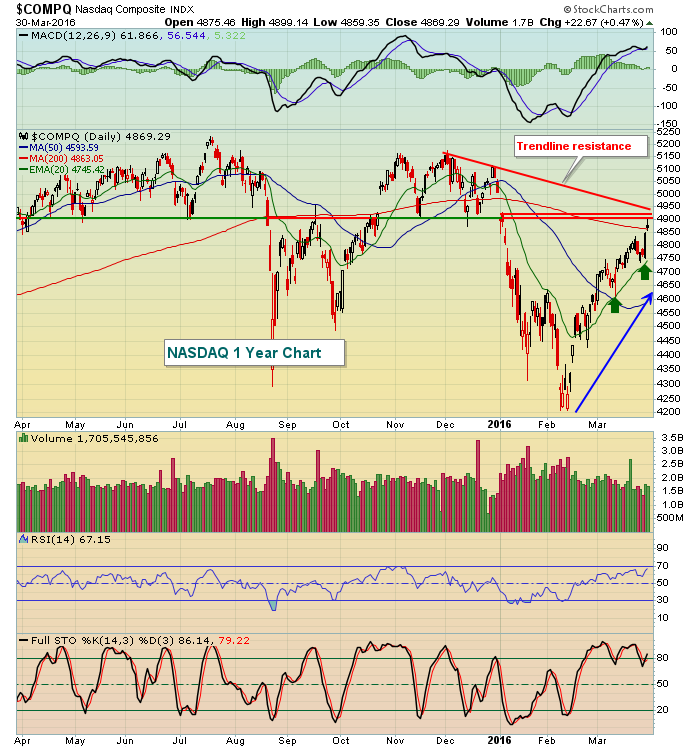 A few comments here. First, with the exception of quad witching day, the volume has been declining, a poor sign. But the uptrend is holding and the rising 20 day EMA continues to provide support (green arrows). Next, the key pivot level of 4900 has just been tested. There's a reaction high on the January 5th gap higher at 4917 and that would seem to be the major price point to watch. If that is cleared, there'll be a much greater chance the NASDAQ will continue its push higher. To the downside, that rising 20 day EMA is the short-term support level to watch.
Sector/Industry Watch
In the Market Recap section above, I highlighted the Food Retailers & Wholesalers industry's short-term breakout. The following is an individual stock within the group that appears to have made a significant breakout. Check it out:
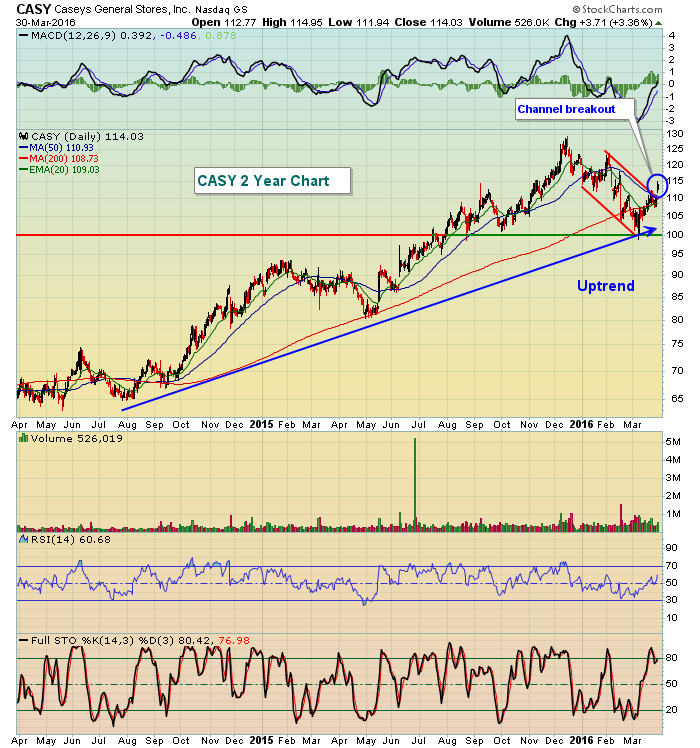 It's been a rough year thus far for CASY, but the downtrend this year is within the confines of a longer-term uptrend. I'd assume this longer-term uptrend will prevail and Wednesday's breakout above down channel resistance looks like the resumption of the uptrend could be resuming.
Historical Tendencies
Today marks the last trading day of Q1 2016. The last trading day of all calendar months tend to be very strong, but for some reason, calendar quarter ends don't seem to follow suit. Here are the annualized returns for the last calendar day of each quarter (based on S&P 500 performance since 1950):
March 31: +2.37%
June 30: +19.38%
September 30: -23.50%
December 31: +33.68%
Those numbers aren't horrible, but knowing that the 30th and 31st of ALL calendar months produce annualized returns of 12.00% and 31.20%, respectively, the calendar quarter end results are a bit disappointing.
Key Earnings Reports
None
Key Economic Reports
Initial jobless claims released at 8:30am EST: 276,000 (actual) vs. 266,000 (estimate)
March Chicago PMI to be released at 9:45am EST: 50.3 (estimate)
Happy trading!
Tom


