Market Recap for Thursday, April 21, 2016
The Dow Jones dropped 114 points on Thursday, marking only the fourth time in the past two months it's lost more than 100 points during a session. The climb has been steady with few declines of any magnitude as energy (XLE) and materials (XLB) have regained their bullish stride. But that hasn't stopped our bouts of bifurcation within sectors and industry groups. For instance, the past couple sessions have been brutal for utilities (XLU), which had been sailing along with few bumps along its 2016 path. The XLU started April at its all-time high, but yesterday closed beneath its rising 50 day SMA for the first time this year. Take a look:
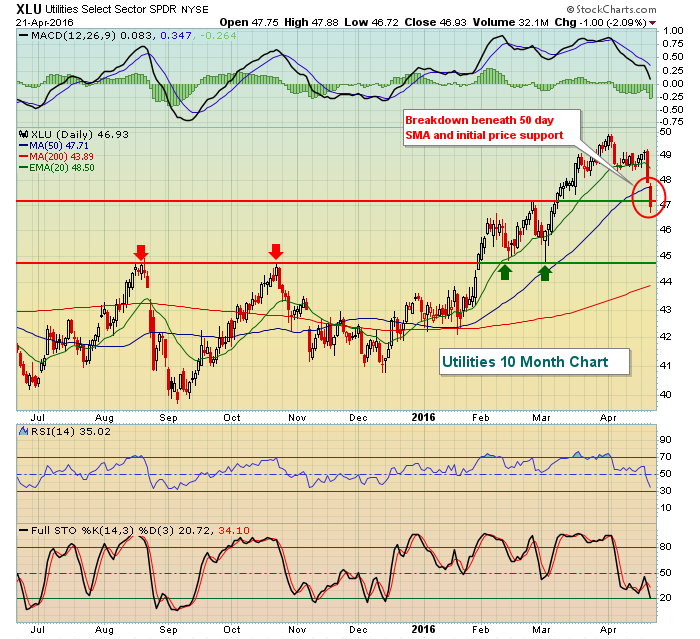
Utilities had a huge run in 2016 as the 10 year treasury yield ($TNX) has tumbled, but the recent surge in yields is clearly playing a role in the sudden downturn. The 44.75 level has proven to be a key pivot area for this sector so that level would represent a solid reward to risk entry into the group. Not reflected above is the fact that the XLU has a very nasty negative divergence on its monthly chart.
Consumer staples (XLP), another sector that was recently among the market's strongest, has suddenly turned lower, dropping 1.56% on Thurday and closing beneath its 50 day SMA. The 50-51 area should prove to be strong support here as well based on the chart below:
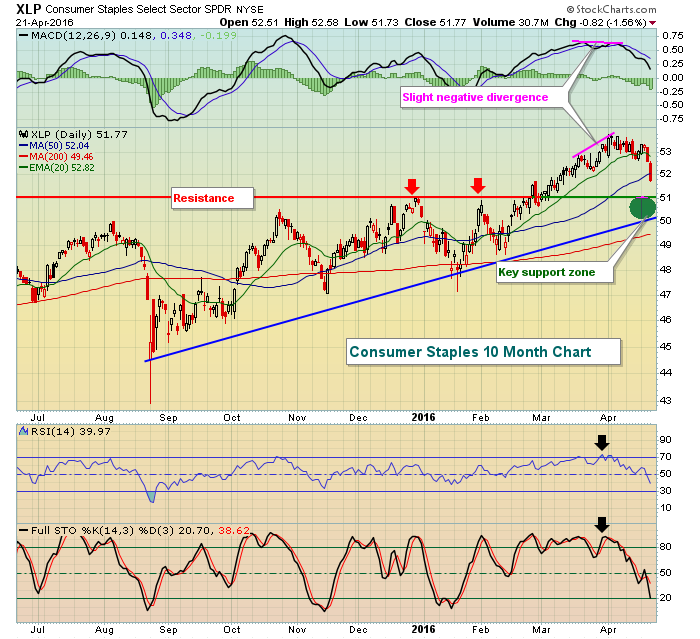 Note that the XLP was overbought at the time that slight negative divergence warned of slowing momentum. The selling emerged after those signals and now the XLP needs to hold onto support in that 50-51 area.
The only significant sector strength came from healthcare (XLV) where biotechs ($DJUSBT) led the rally and broke out to a level not seen since early January. Check out the Current Outlook section below for more details on biotechs.
Pre-Market Action:
U.S. futures are flat as traders digest an acceleration of selling on the Dow Jones and S&P 500 from Thursday. While the selling isn't unusual given that our major indices were stretched and overbought with respect to both RSI and stochastic, we do have to keep in mind there are negative divergences across many indices, sectors and industry groups so it wouldn't be out of the question to see selling accelerate in the near-term.
The Nikkei ($NIKK) had another strong session overnight, gaining 1.20%, other indices there were not so fortunate with the Hang Seng ($HSI) losing .72% and the Shanghai Composite ($SSEC) flat. European indices are down this morning.
Earnings are picking up and a few notable NASDAQ stocks are struggling this morning after disappointing results. Alphabet (GOOGL), Microsoft (MSFT) and Starbucks (SBUX) are all down this morning after coming up short of expectations.
Current Outlook
Biotechs ($DJUSBT) are an aggressive area of healthcare and I'm always interested in the performance of aggressive areas. The good news is that the DJUSBT cleared its recent high with a MACD also moving higher. That tells us that price momentum is accelerating. The problem I see with the chart is that volume was simply average and that doesn't necessarily speak of strong momentum. So mixed signals here. But here's the chart nonetheless showing the breakout:
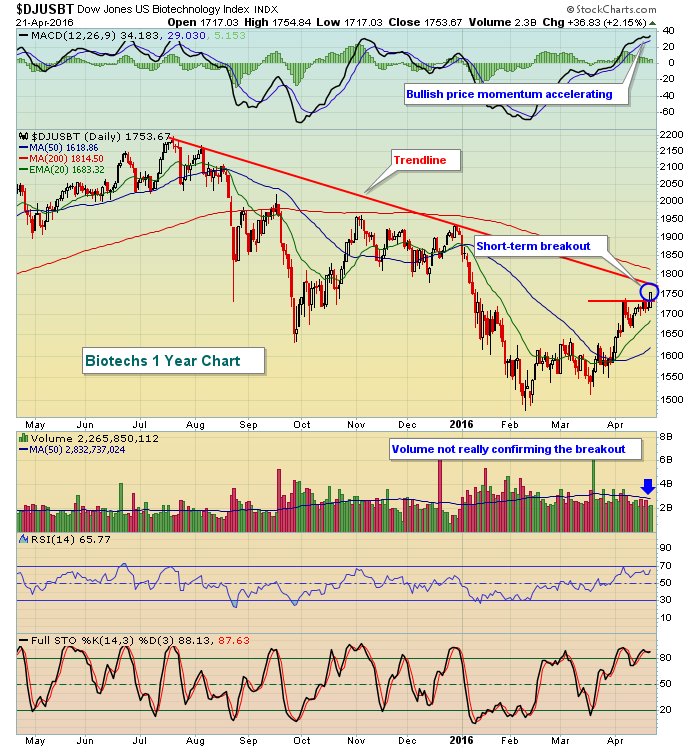 Another problem is that downtrend line which has been touched on a few occasions. So while the recent price breakout is nice, the bulls' work is not done here. Biotechs are an influential part of healthcare and the overall market, so clearing the trendline would be significant.
Sector/Industry Watch
Germany (DAX) is now showing much more bullish short-term indications on its chart and that's good news for the U.S. as there's a strong positive correlation between the DAX and S&P 500. The longer-term charts of both indices are a bit more dicey as key price resistance, moving averages and trendlines still must be negotiated, but the outlook has clearly improved. The following is a daily chart of the DAX:
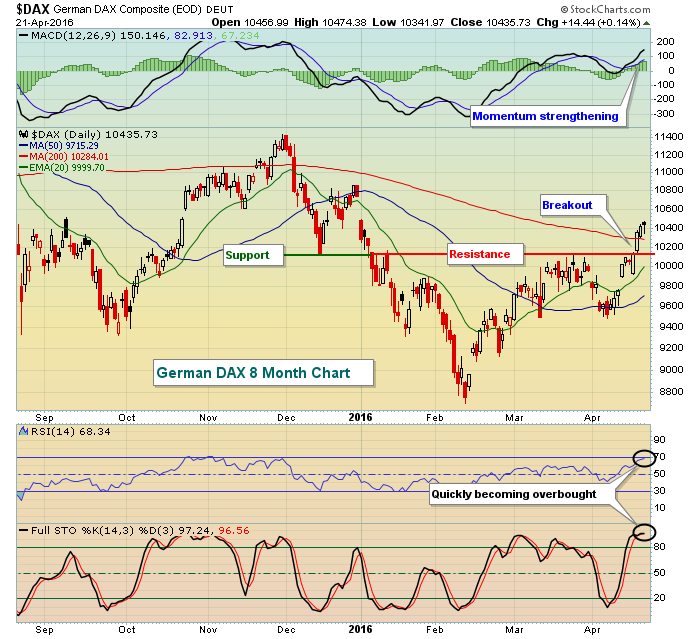 Technically, the improvement here is apparent to me, but the DAX has turned very overbought after its recent breakout and is in need for short-term profit taking to relieve its overbought oscillators.
Historical Tendencies
Thus far, the German DAX has been performing as expected during the month of April as April has produced the highest average monthly gains (+3.3%) of all calendar months over the past 20 years. Take a look at the seasonality chart below:
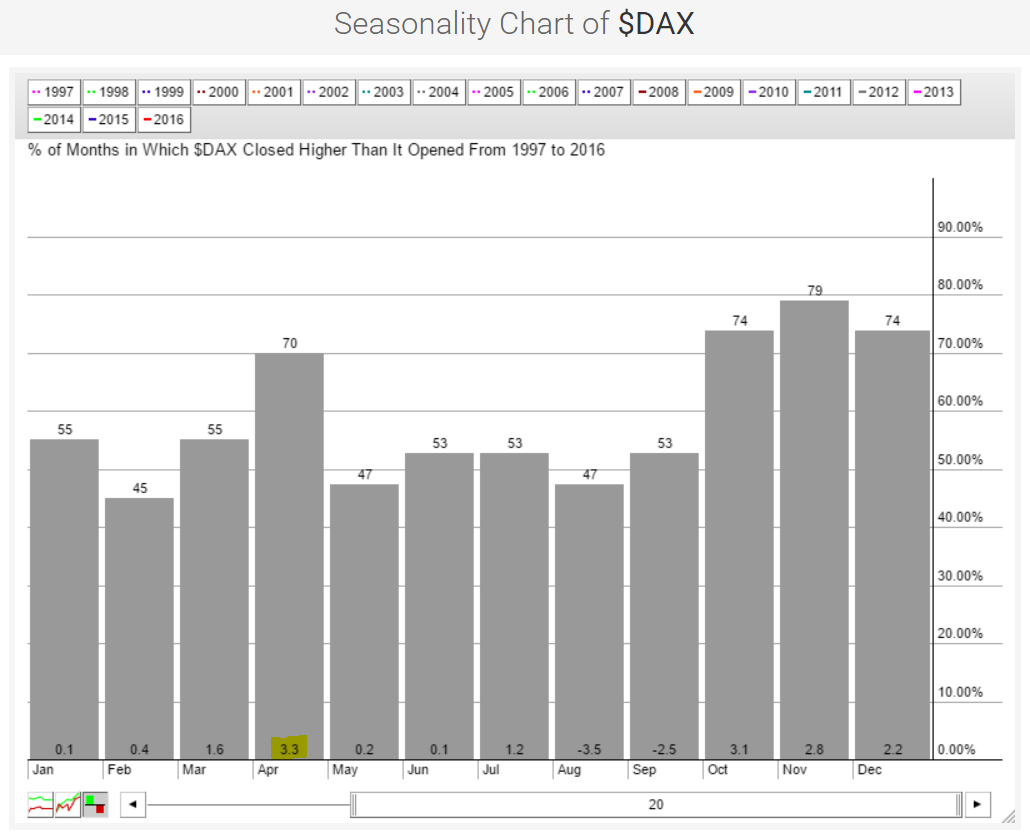 While the fourth quarter provides higher odds of months finishing higher, none of those months tops April's 3.3% average monthly return. The obvious question mark moving forward relates to the lackluster historical performance as we head into May and throughout the remainder of spring and summer.
Key Earnings Reports
(actual vs. estimate):
AAL: 1.25 vs 1.18
CAT: .67 vs .67
GE: .21 vs .21
HON: 1.53 vs 1.50
KMB: 1.53 vs 1.51
MCD: 1.23 vs 1.16
STI: .84 vs .76
Key Economic Reports
April PMI manufacturing to be released at 9:45am EST: 52.0 (estimate)
Happy trading!
Tom


