Market Recap for Friday, April 22, 2016
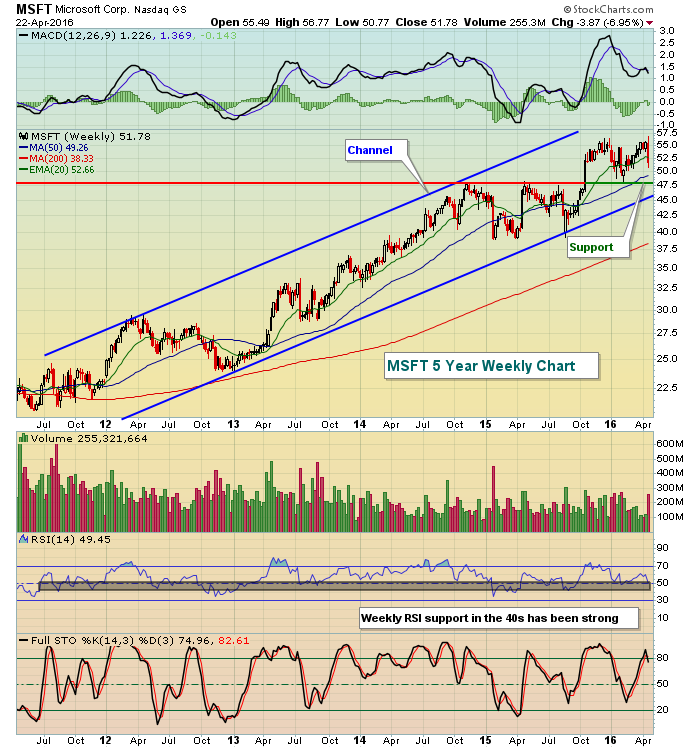
The technology world (-1.74%) was rocked on Friday with disappointing earnings announcements from a host of NASDAQ names, particularly a couple large technology companies. Microsoft (MSFT) stumbled badly, losing 7.17% after posting EPS that fell slightly below expectations. Revenue guidance in the quarter ahead also fell short of analysts' earlier predictions. The good news, however, is that the long-term uptrend in Mr. Softie's chart remains intact. Take a look:
 While the pain on Friday was apparent, I wouldn't grow bearish on MSFT as long as it holds its long-term trendline support just above 45.00, price support in the 47.50-48.00 range, and its rising 50 week SMA, currently at 49.26.
Also disappointing from earnings after the bell on Thursday were Alphabet (GOOGL) and Starbucks (SBUX), which fell 5.41% and 4.88%, respectively, during Friday's session. That was simply too much for the NASDAQ to overcome as it was easily the worst performing major index on Friday. The Russell 2000 performed extremely well, gaining nearly 1% as the stock market continues its bifurcated ways. The Dow Jones and S&P 500 were closer to the flat line.
In a familiar recent theme, energy (XLE) and financials (XLF) performed well on Friday, helping to lead the Dow Jones and S&P 500 to an afternoon rally that eliminated losses from earlier in the session.
Pre-Market Action
The 10 year treasury yield ($TNX) remains just beneath the 1.90% level. It will be interesting to watch the action in treasuries over the next couple days leading up to the FOMC announcement on Wednesday. A breakout in the TNX above 2.00% would be very bullish for equities - at least in the near-term.
U.S. futures this morning are down fractionally as we approach the opening bell, just 30 minutes away.
Current Outlook
Nothing is easy about this market. Energy refuses to let the Dow Jones and S&P 500 roll over now just as the group refused to allow both indices to break out from mid-2014 through 2015. It was the enemy of the bulls for 18 months and now it's the enemy of the bears.
Among aggressive areas of the market, the jury is still out. We've seen improvement in key areas, supporting a further S&P 500 advance, but it's anything but an all out signal to buy U.S. stocks. And we know we have the late spring and summer months ahead, generally a problem for stock market bulls.
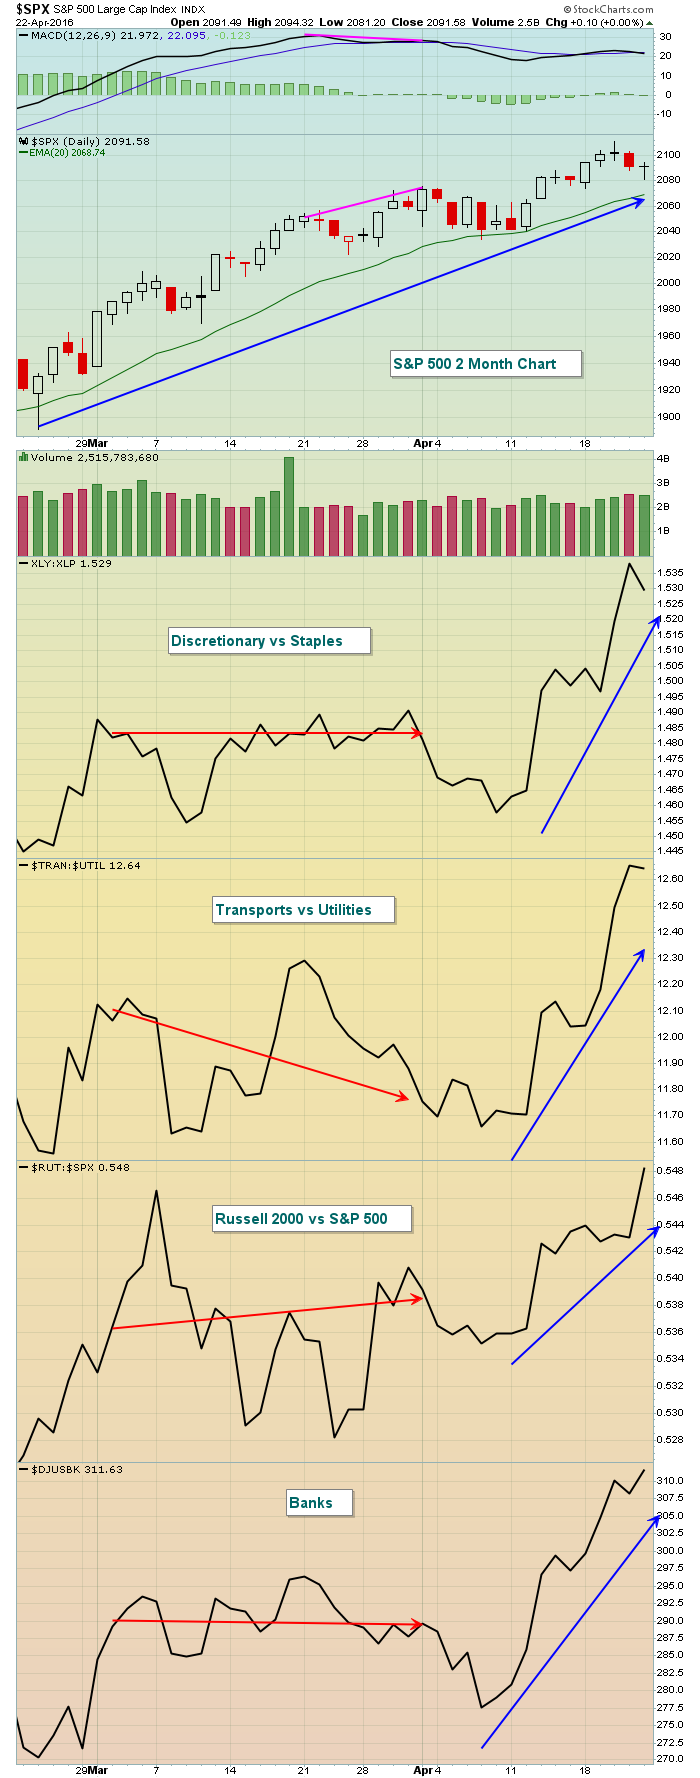
Here's the latest look at key relative ratios and how they're performing vs. the S&P 500:
 All have turned higher in April and that's much more bullish for sure. The problem is that none of these relative ratios or indices are close to breaking to fresh highs. But the S&P 500 is, only 2% or so beneath its all-time high close. So we have to admit the shorter-term is looking more bullish, but these relative ratios need to continue to climb to support the likelihood of higher prices over the summer.
Sector/Industry Watch
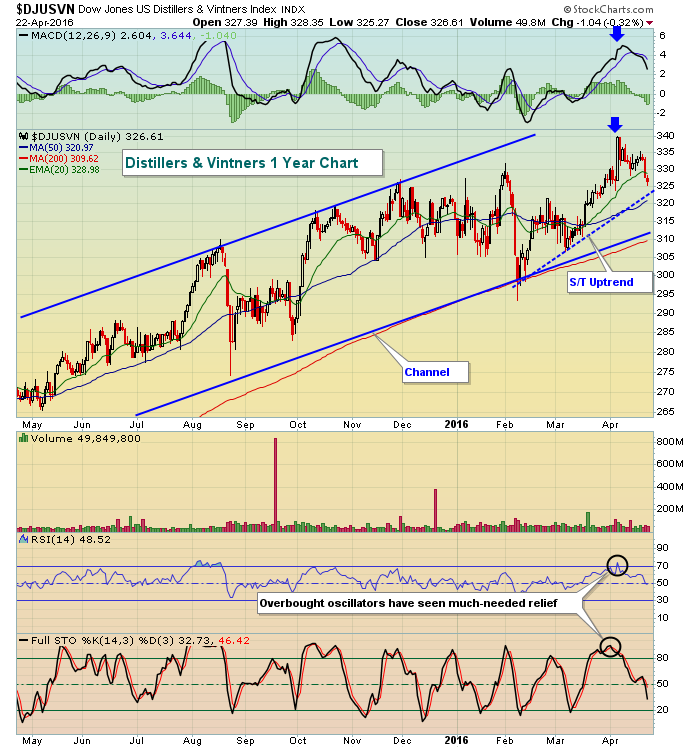
In terms of stock market performance, it truly is the season to be drinking. Distillers and vintners ($DJUSVN) have their three best consecutive calendar months from April through June. These historical tendencies are documented below in the Historical Tendencies section. But the technical pattern remains strong for the group also. Below is a chart showing the uptrend intact despite weakness over the past couple weeks. Have a look:
 Early in April, the DJUSVN pushed into overbought territory with strong momentum at its price high (blue arrows). That typically results in selling down to test its rising 20 day EMA. Currently, we're just beneath that 20 day EMA and momentum oscillators have dipped with the RSI now in the 40s. The reward to risk has been fairly solid in the past when the RSI fell into the 40s. I'd look for a bounce in this group soon.
Historical Tendencies
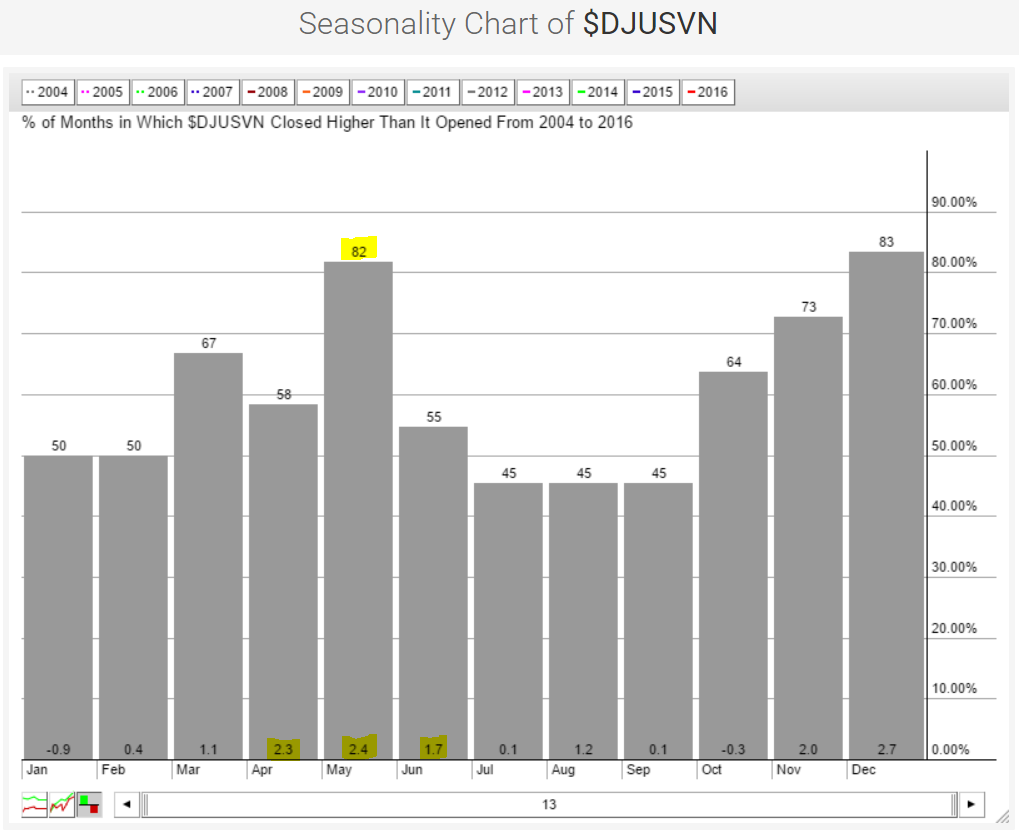
There are very few industry groups that have a history of doing well during the month of June, but the third best industry group during that month (at +1.7%) also performs very well during April (+2.3%) and May (+2.4%) over the past 13 years. That industry belongs to the consumer staples sector and is the Dow Jones U.S. Distillers & Vintners Index ($DJUSVN). Thus far, April has been a down month for the DJUSVN, but it does remain in a bullish pattern as reflected in the Sector/Industry Watch section above. Here's the historical data as reflected in its seasonal chart:
 We're a week away from entering May, which has performed better than any calendar month other than December. The DJUSVN has risen during May 82% of the time over the last 13 years, again trailing only December.
Key Earnings Reports
(actual vs. estimate):
FDC: .24 vs .21
HAL: .05 (estimate - haven't seen actual results yet)
LH: 2.02 vs 1.96
XRX: .22 vs .23
(reports after close, estimate provided):
CDNS: .18
CNI: .68
ESRX: 1.23
NXPI: .83
Key Economic Reports
March new home sales to be released at 10:00am EST: 522,000 (estimate)
Tomorrow begins the latest FOMC meeting with an announcement scheduled for Wednesday 2:00pm EST.
Happy trading!
Tom


