Market Recap for Monday, April 4, 2016
During my Monday webinar (CLICK HERE for recording), I highlighted a few red flags regarding a possible short-term market downturn. Among those were negative divergences across our major indices. The Moving Average Convergence Divergence (MACD) is a momentum oscillator designed to track price momentum. While one limitation of the MACD is that it ignores volume, it does a solid job of tracking price momentum in both directions. From the chart below, you can see that a negative divergence on the MACD emerged on the 60 minute chart on Monday and previous negative divergences resulted in short-term selling below 50 hour SMAs and saw resets of the MACD centerline (pink arrows):
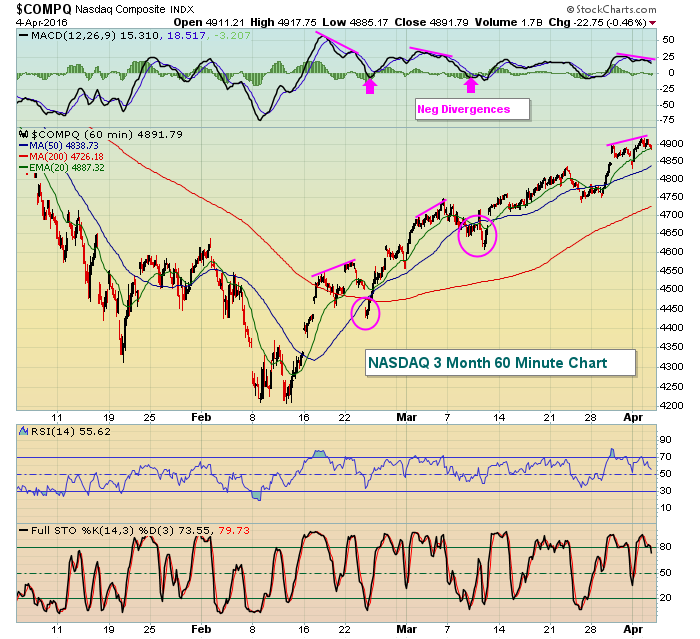 This negative divergence suggests we'll see selling ahead and futures are down this morning. How much selling is "okay selling"? I take a look at that in more detail in the Current Outlook section below.
Selling was seen across each of our major indices with the Russell 2000 (small caps) taking the brunt of the selling. Among sectors, materials and industrials led the selling with losses of 1.30% and 1.13%, respectively.
Transportation stocks ($TRAN) were hit hard and closed almost squarely on their rising 20 day EMAs. While losing that moving average would be a negative development for equities, the now-rising 20 week EMA will be much more important in the long-term and that key moving average resides roughly 2.5% lower at 7631. Here's the chart:
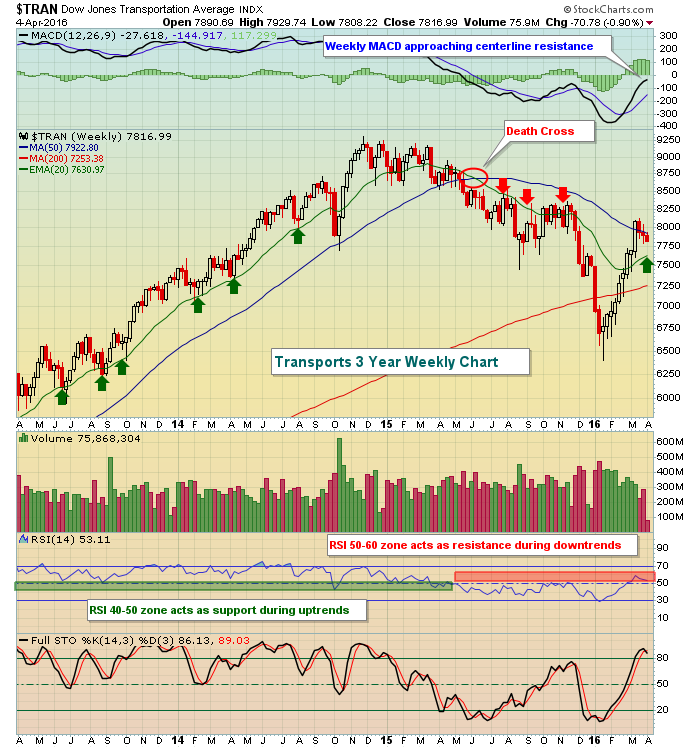 Those red and green arrows show how significant the 20 week EMA can be during uptrends and downtrends. So keep an eye on that rising 20 week EMA for signs of strength or weakness.
Healthcare stocks (XLV) bucked the selling trend on Monday by gaining 1.20%, led by medical equipment's ($DJUSAM) 1.55% rise.
Pre-Market Action
It's a fairly light morning of economic and earnings news, but the fact that crude oil ($WTIC) is under pressure again has traders concerned. Oil recovered off earlier lows, but it has fallen beneath rising 20 day EMA support and is likely seen by many traders as a sign of global economic weakness.
Asian markets were mixed overnight with losses in both Japan (-2.4%) and Hong Kong (-1.6%). China's Shanghai Composite ($SSEC) bucked the trend, however, and finished with a nice 1.5% gain.
One HUGE problem the U.S. will face today is the large losses in Europe, particularly in Germany with the DAX down 232 points at last check. That puts the DAX at 9585 and below its 50 day SMA for only the second time in six weeks. There is a tight positive correlation between the DAX and S&P 500 so this weakness across the pond is worth noting. Further selling in Germany today and in the days ahead will likely impact U.S. equities in similar negative fashion.
Current Outlook
The 60 minute negative divergences that I pointed out earlier warn us of short-term weakness. The prior two 60 minute negative divergences simply took the NASDAQ down to test its rising 20 day EMA on the daily chart. Check it out:
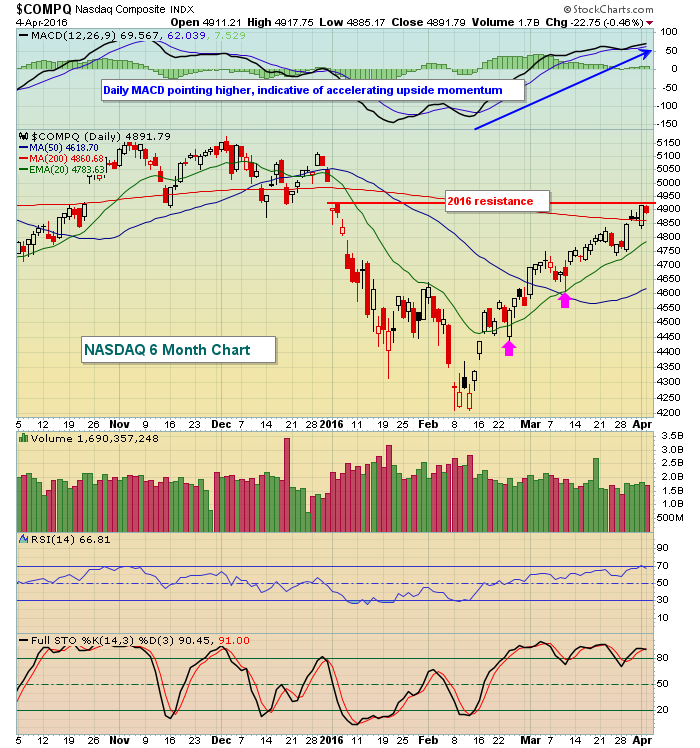 After the large, heavy volume gap down to open 2016, the high candle body (January 5th open) was 4917.84. Friday we hit an intraday high of 4917.09 and yesterday we saw an intraday high of 4917.75. Also, after pushing through a key price resistance level of 4736 (bottom of January 7th gap resistance), I had mentioned there was little resistance until we reached the 4900 level. We're there. So it's important to recognize the key price resistance level, coupled with the negative divergence that just printed. Currently, I'd view the trading range here to be 4736-4917. Let's see which side breaks first.
Sector/Industry Watch
Home construction ($DJUSHB) is a key component of the consumer discretionary (XLY) space and a key component of our economy. The technical signs currently are troubling as you can see below:
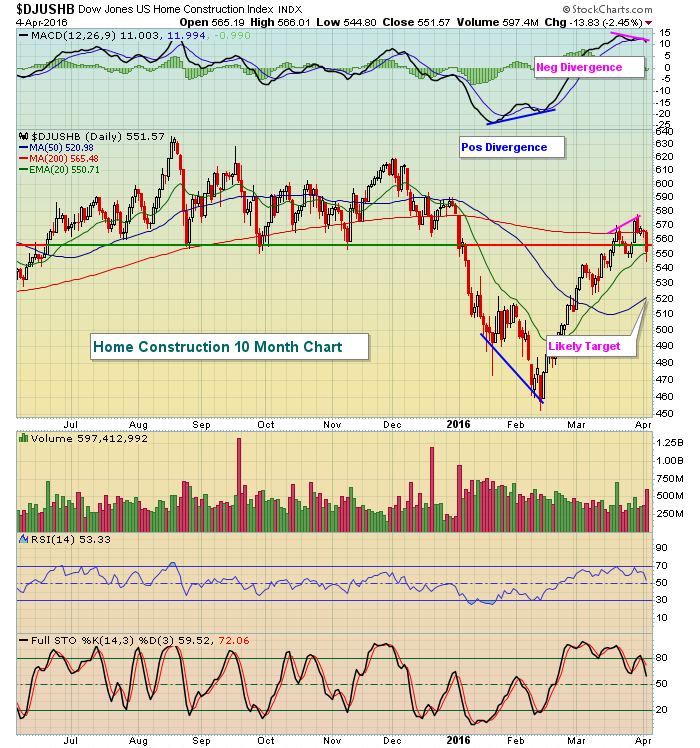 We saw during March that money stopped rotating into aggressive areas of the market with one of those areas being consumer discretionary (vs. consumer staples). By the looks of this home construction chart, it doesn't appear that the DJUSHB will be helping the XLY:XLP ratio any time soon. It was notable for this group to clear 550-560 price resistance, but losing this level with a negative divergence in play doesn't bode well - especially given the earlier discussion regarding the negative divergences on our major indices.
Historical Tendencies
Over the past 17 years, the Dow Jones U.S. Gambling Index ($DJUSCA) has risen 9 times and fallen 8 times in April - seemingly a wash. But it's average gains during the month of April are 7.1% over this 17 year period. Check out this seasonality chart:
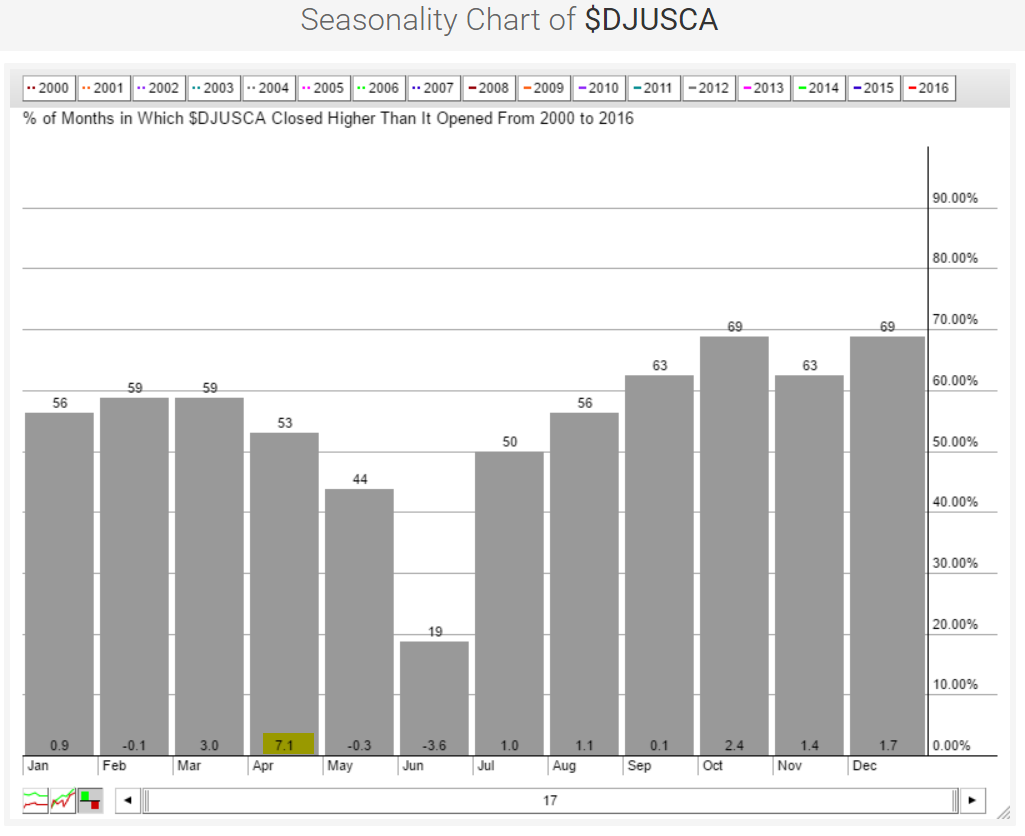 April's average gains are more than double any other calendar month the past 17 years. This is a group worth keeping on your radar, especially if we see upcoming weakness as the reward to risk here could improve significantly.
Key Earnings Reports
(actual vs. estimate):
DRI: 1.21 vs 1.20
Key Economic Reports
None
Happy trading!
Tom


