Market Recap for Tuesday, April 5, 2016
U.S. equities had a rough day from the opening bell on Tuesday. The Dow Jones fell more than 100 points in a session for the first time in nearly a month as the rally off the February 11th bottom has continued to unfold. The largest percentage loss was felt on the Russell 2000 ($RUT), where that small cap index fell 1.14% and closed on its low of the day. I'm highlighting the potential downside target for the RUT in the Current Outlook section below.
Germany had a rough day on Tuesday, losing 259 points or 2.63%. I view this as a big negative for U.S. stocks and I explain why in the Sector/Industry Watch section below. The weekly downtrend appears to be resuming and that could put pressure on stocks here.
Among sectors on Tuesday, the red-hot utilities sector sold off 1.88% to approach its rising 20 day EMA. Despite leading to the downside on Tuesday, the XLU remains the best performing sector over the past three months, six months and year.
Pre-Market Action
We're seeing a slight bounce in the 10 year treasury yield to 1.74%, but the direction of the yield over the past three weeks has been lower as it's dropped from near 2.0% to yesterday's intraday low of 1.72%. There's a very significant yield support level at 1.65% approaching. Of course, the falling yield tells us that money is rotating toward the defensive bond market.
After a brief stint in positive territory, German shares are once again under a bit of pressure this morning. There are gains in both the French CAC and London FTSE, however. Overnight, Asian markets finished basically unchanged with slight gains and/or losses across the board there.
We can point to the recovery in crude oil prices ($WTIC) as one reason U.S. futures are higher this morning. Personally, I'd feel better about a bounce in U.S. shares for the day if we see a strong finish in Germany.
Current Outlook
It's not good to see the Russell 2000 underperforming the S&P 500 as it's one indication that we're in a "risk off" market environment, one in which stock prices typically decline. On the daily chart, there's a slight negative divergence and I'm also illustrating the deteriorating relative strength of small caps. Take a look:
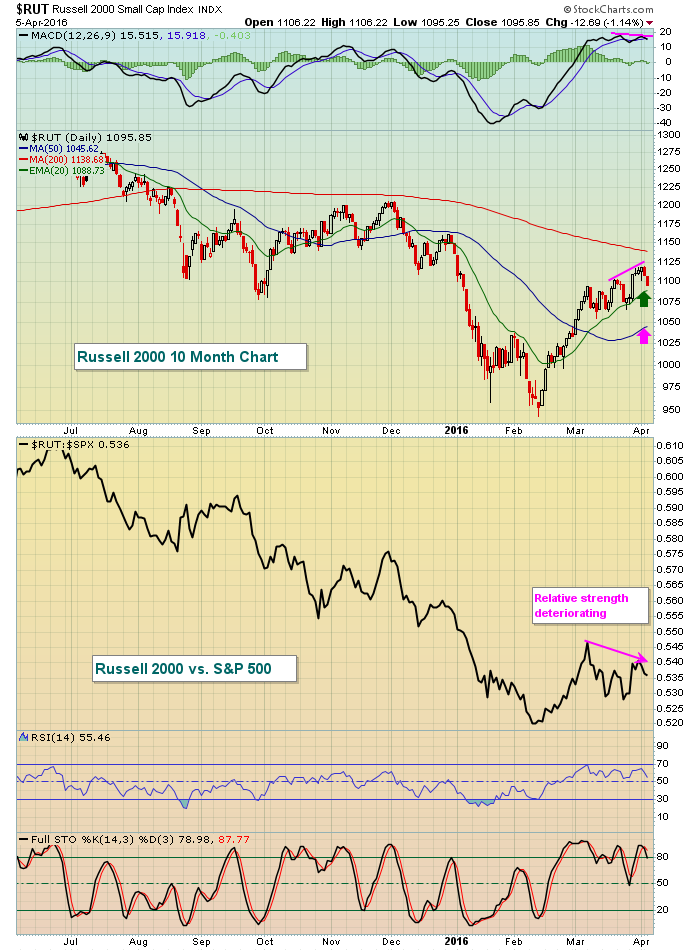 The two support levels I'll be watching are (1) the rising 20 day EMA (green arrow) and (2) rising 50 day SMA (pink arrow). Given the negative divergence in play, failure to hold the rising 20 day EMA tends to lead to a 50 day test. Currently, the 50 day SMA is at 1045. The uptrend off the February 11th bottom shows a series of higher highs and higher lows. That trend would be compromised by a push beneath the 1050 area as well. Take a look:
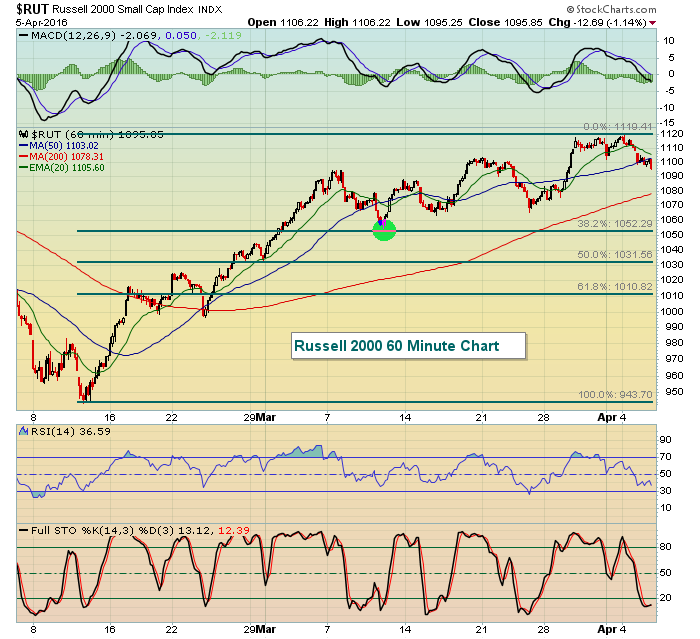 The green shaded circle highlights the initial reaction low near 1050 after the parabolic rise throughout February and early March. 1050 also marks key Fibonacci support (38.2% retracement).
Because the longer-term downtrend in small caps remains in play, a drop below 1050 would likely trigger resumption of that prior longer-term downtrend. So I would mark 1050 as the major support level for small caps should the short-term selling accelerate.
Sector/Industry Watch:
Today, let's discuss Germany in this area - even though it's not a sector or industry group. There is a clear and unmistakable link between the direction of German shares and the direction of U.S. shares. This long-term chart illustrates it:
 The correlation indicator has been almost exclusively above zero over the last 10 years. Positive readings suggest positive correlation. In other words, as one index moves directionally, the other tends to follow suit. Much of the last 10 years has shown a positive correlation near 1 and this indicates that the two indices tend to move hand in hand. So what happens in Germany is vitally important to U.S. equities.
Now let's talk German DAX technicals. The red arrow on the chart above shows failure of the DAX at the declining 20 week EMA with a MACD that is showing accelerating selling momentum. Not good. The good news is that the uptrend remains intact off the 2007 low. But it's a very real possibility we could be heading back beneath 9000 to test the rising trendline or price support or both. If that occurs, the S&P 500 will likely be heading south too.
Historical Tendencies
Since 1971, the NASDAQ is generally quite bullish once we move past April 7th (tomorrow) and head toward April 18th. The one exception is April 13th and April 14th, which have produced negative annualized returns of -55.18% and -77.69%, respectively. My theory here is that U.S. income taxes are due April 15th, triggering the sale of stocks to generate the proceeds used to meet income tax obligations.
Key Earnings Reports
(actual vs. estimate):
GPN: .70 vs .64
MON: 2.42 vs 2.45
STZ: 1.19 vs 1.14
(reports after close, estimate provided):
BBBY: 1.80
Key Economic Reports
None, although the FOMC minutes will be released at 2pm EST.
Happy trading!
Tom


