Market Recap for Tuesday, April 19, 2016
Nothing seems to be able to slow down this market freight train. Not disappointing housing data. Not a continuing rush into treasuries. Not weak guidance from IBM and Netflix (NFLX). Not negative divergences across multiple time frames. Literally nothing. Yes, the market did finish bifurcated on Tuesday with relative strength on the Dow Jones and S&P 500, but considering the negatives that were lined up, that performance was quite impressive.
Technology and consumer discretionary were weak, losing .56% and .55%, respectively, and that held back NASDAQ shares as the NASDAQ 100 ($NDX) fell .71%. Retailers were notably weak with specialty retailers ($DJUSRS) tumbling 2.46%. But the 1.06% fall in home improvement retailers ($DJUSHI) were perhaps more significant technically as they printed a reversing candle at key price resistance with a negative divergence in play. Check it out:
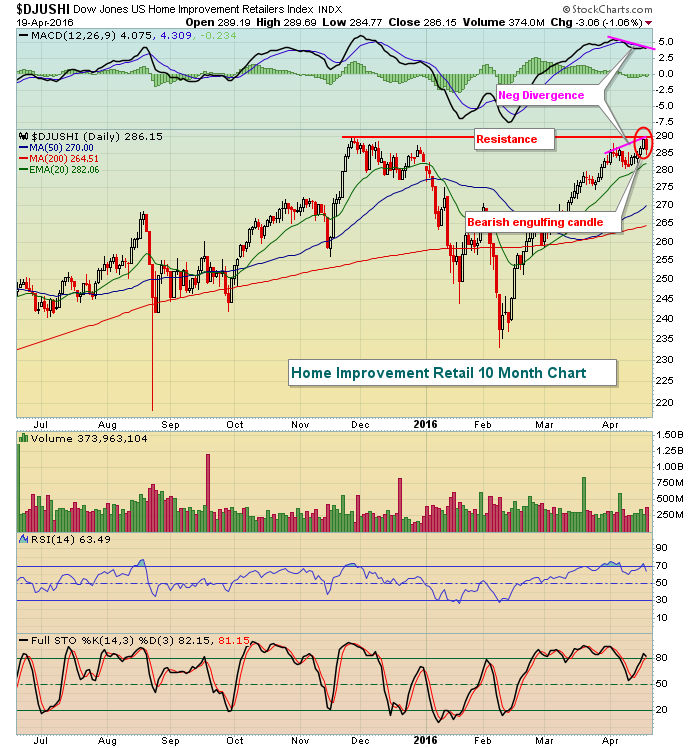 Breaking and closing above 290 will be critical to further gains in this space.
Technology was hurt in large part due to the reaction to IBM's quarterly earnings as the computer services index ($DJUSDV) fell 3.58%. IBM was lower by 5.59%, clearly impacting the group. Semiconductors ($DJUSSC) also are showing signs of weakness and slowing momentum and are featured below in the Sector/Industry Watch section below.
Materials (XLB) and energy (XLE) were again the bright spots as they've been throughout this rally. The XLB and XLE jumped by 2.14% and 2.00%, respectively, far outpacing the other seven sectors. Crude oil ($WTIC) gained more than 2%, closing back above $42 per barrel, to buoy energy stocks.
Pre-Market Action
U.S. futures were lower overnight, but recently turned positive as we approach a new trading day. Equities were lower in Asia overnight and trading this morning has been mostly flat in Europe.
Intel (INTC) guided revenues lower for its upcoming second quarter and the stock is down nearly 2% in pre-market trading.
The 10 year treasury yield ($TNX) continues to hover below 1.80% at money is not exactly exiting rotating away from treasuries.
Current Outlook
The slowing momentum issues are only getting worse. Over the past couple days, it hasn't seemed to matter, but experience says that it does indeed matter. Negative divergences do not always work. Nothing in technical analysis provides us a guarantee. But these negative divergences are warning signs and, whether they work or not, that's not what's important. They tell us to be cautious, to change our short-term strategies. They tell us to make sure we keep our stops in play if we're long because selling does have the tendency to accelerate when negative divergences print. And those negative divergences are everywhere. They're quite pronounced on the S&P 500's daily chart, as you can see below:
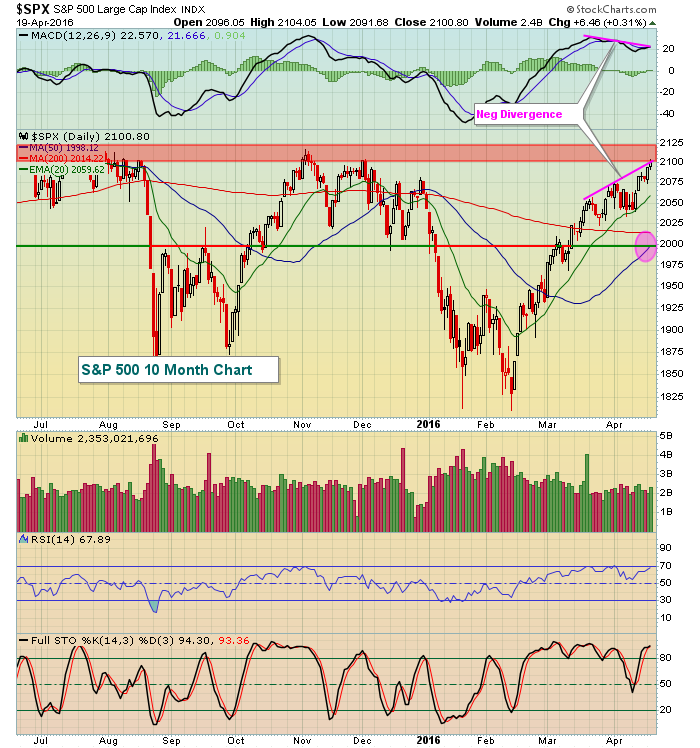 When a negative divergence prints, I look for a 50 period SMA test to "reset" the MACD back to its centerline. The pink circle above shows that the 50 day SMA is currently at 1998, very close to the 1995-2000 price support area. That represents the "potential" for a 5% decline on the S&P 500 from current prices.
Sector/Industry Watch
Semiconductor stocks ($DJUSSC) are a key component of the technology sector and they've performed quite well off the February low. However, they managed to close beneath their rising 20 day EMA with a negative divergence present. Take a look at the short-term issues:
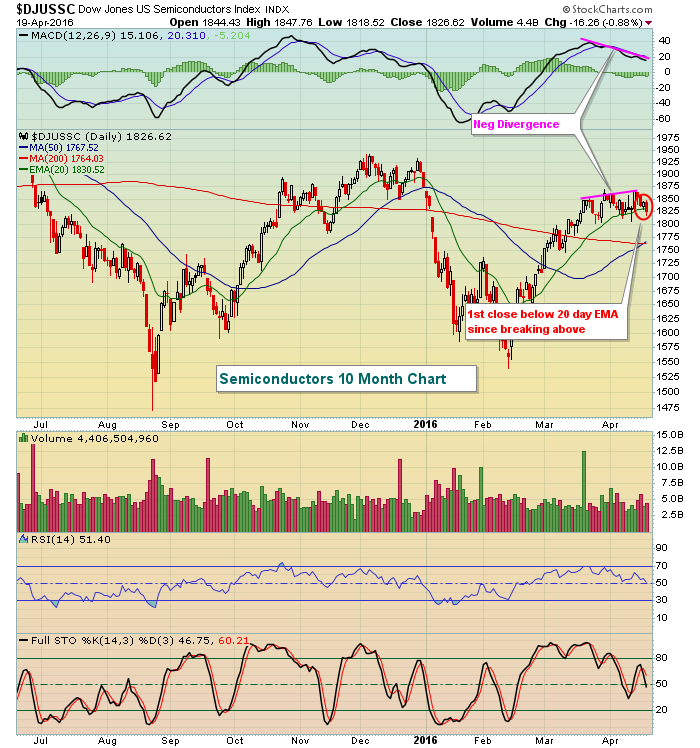 The bulls would like to see that 20 day EMA reclaimed immediately, while the alternative would likely lead to an upcoming 50 day SMA test. At that point, we'll likely find out whether weakness accelerates or not.
Historical Tendencies
Wednesdays have been the best calendar day of the week for U.S. equities. In fact, Wednesdays have produced annualized returns of greater than 25% on the NASDAQ since 1971.
Key Earnings Reports
(actual vs. estimate):
EMC: .31 vs .32
KO: .45 vs .44
USB: .76 vs .75
(reports after close, estimate provided):
AXP: 1.36
CTXS: .74
FFIV: 1.27
KMI: .18
LRCX: 1.10
LVS: .61
MAT: (.08)
NEM: .19
QCOM: .82
SLG: 1.65
TSCO: .46
UAL: 1.17
YUM: .83
Key Economic Reports
March existing home sales to be released at 10:00am EST: 5,268,000 (estimate)
Happy trading!
Tom


