Market Recap for Tuesday, May 3, 2016
Energy (XLE) was hit hard on Tuesday as all nine sectors retreated. But the XLE's drop of 2.36% was notable as it nears a key short-term price support level and its rising 20 day EMA, both generally strong areas during an uptrend. Here's a current look at the XLE, visually identifying support to watch in the latter half of this week:
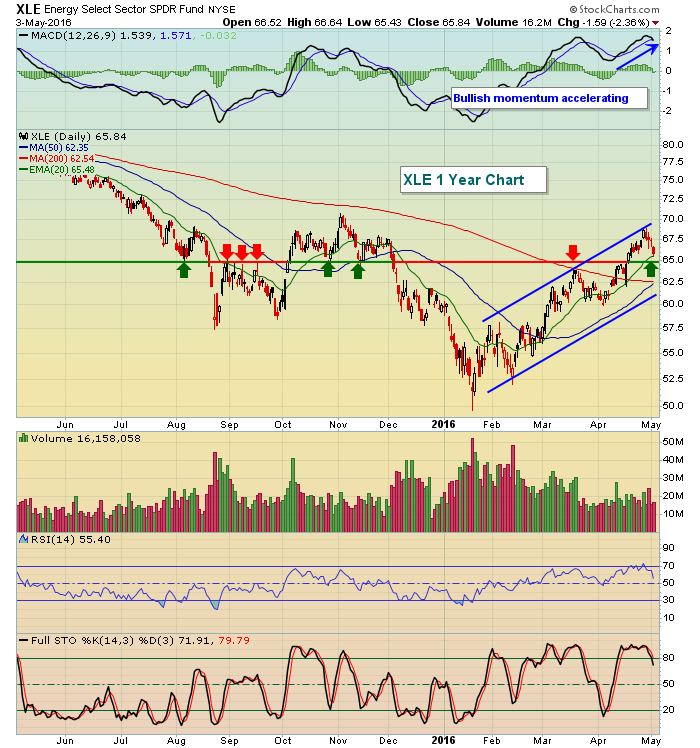 Note that the XLE bounced off its rising 20 day EMA on Tuesday, but with futures pointing lower this morning, we could see a test that extends down to price support closer to 65. That level has produced many reversals over the past year and should be respected. Loss of both price and moving average support would likely lead to a test of channel support (lower blue uptrend line).
Profit taking in gold (GLD) and gold-related shares contributed to a 1.65% decline in basic materials (XLB). Both energy and materials have led the U.S. stock market over the past three months so at this point I'd consider recent selling to be nothing more than normal profit taking. Should the U.S. dollar ($USD) fail to hold major intermediate-term support near 92.00-93.00, I'd look for further gains in both the XLE and XLB. The USD is analyzed in the Current Outlook section below while a long-term view of gold is provided in the Sector/Industry Watch below.
Pre-Market Action
Asian markets were lower overnight with the Hang Seng ($HSI) down another 150 points to approach both gap and 50 day SMA support. The HSI has not closed beneath 50 day SMA support since the first trading day of March, or two months ago. In Europe, the French CAC ($CAC) and London FTSE ($FTSE) have already broken beneath 50 day SMA support and the German DAX ($DAX) isn't far behind.
Here in the U.S., futures are pointing to another rough start with the Dow Jones set to begin the day 100 points lower. The ADP employment report came in well below expectations and with job growth on the minds of most market participants, it's not too surprising to see those negative divergences continuing to hold the U.S. equity market hostage. 50 day SMA tests are likely, possibly this week.
Current Outlook
The dollar's weakness is coming more and more into focus as traders look for movement here to determine where they want to allocate their short-term resources. On the following daily chart, you can see that the dollar is at a very significant level of support that needs to hold. Of course, if you're holding energy and materials stocks on the long side, you want to see the dollar continue to slide. Take a look:
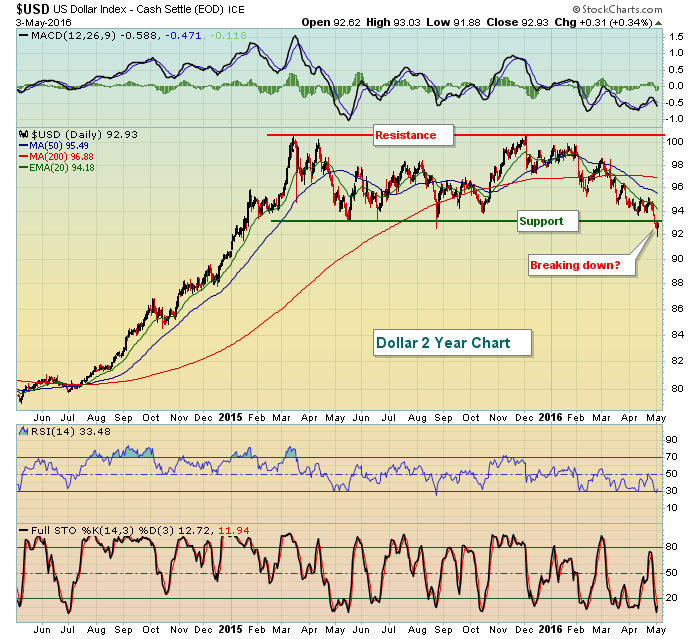 Based on the above analysis, it appears as though the dollar is breaking down. But it did print a long tail yesterday, bouncing off intraday lows. Is that marking a bottom just below support to serve as a head fake? Or is the deterioration more significant and something likely to lead to further losses in the dollar? Stay tuned. But check out the gold chart in the section below, because gold longs would love to see further dollar weakness.
Sector/Industry Watch
Gold is typically a major beneficiary from dollar weakness so it's important to watch support on the USD very closely. A bounce in the dollar would have negative consequences for gold, but a breakdown would provide the impetus for further gains. Note in particular the correlation indicator below the gold price chart that demonstrates the inverse relationship between gold and the dollar:
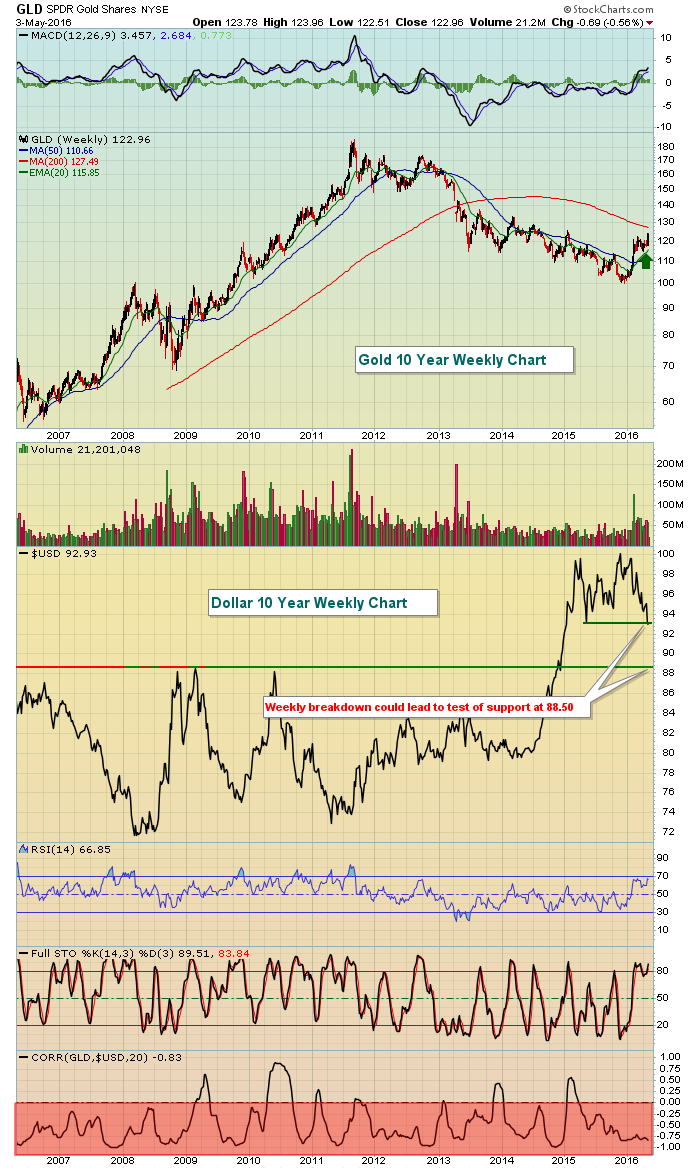 On the GLD, the 20 week EMA has crossed back above the 50 week SMA, indicative of improving price action, and the MACD back above the zero line shows strengthening bullish momentum. But the dollar's course will likely determine how far this rally in gold goes. The dollar is on the verge of a weekly price breakdown that could carry the greenback 4-5% lower. Such a drop would likely send traders scurrying into gold. Watch the rising 20 week EMA on the GLD for support. At the bottom of the chart (red shaded area), you can see that the GLD/USD correlation is almost entirely in negative territory (between 0 and -1). That tells us that there's an inverse relationship between gold and the dollar.
Historical Tendencies
On the NASDAQ, Wednesdays have produced annualized gains of roughly 25% over the past 45 years. We also know that the 28th day of calendar months through the 6th day of the following calendar month typically carry bullish historical implications. Wednesdays during this 10 day period produce even higher annualized returns. Despite these historical tendencies, futures are pointing to a much lower open.
Key Earnings Reports
(actual vs. estimate):
BUD: .51 vs .87
D: .96 vs .95
GOLD: .57 vs .56
HUM: 1.86 vs 1.81
ICE: 3.68 vs 3.67
PCLN: 9.37 vs 8.73
TWX: 1.49 vs 1.29
(reports after close, estimate provided):
CB: 2.19
FIT: (.04)
KHC: .61
LNC: 1.48
MCHP: .60
MCK: 3.01
MET: 1.39
PRU: 2.38
TRIP: .37
TSLA: (.78)
WBMD: .33
WFM: .41
WMB: .10
Key Economic Reports
April ADP employment report released at 8:15am EST: 156,000 (actual) vs. 193,000 (estimate)
Q1 productivity to be released at 8:30am EST: -1.0% (actual) vs. -1.2% (estimate)
April PMI services index to be released at 9:45am EST: 52.0 (estimate)
March factory orders to be released at 10:00am EST: +0.6% (estimate)
April ISM non-manufacturing index to be released at 10:00am EST: 54.7 (estimate)
Happy trading!
Tom


