Market Recap for Monday, May 2, 2016
Consumer discretionary (XLY) and consumer staples (XLP) were the sector leaders on Monday as they posted gains of 1.40% and 1.15%, respectively. But like so many areas of the market, even sizable gains and market leadership come with warning signs and caution flags. With the XLY, one quick look at the chart summarizes the issues facing this aggressive consumer space:
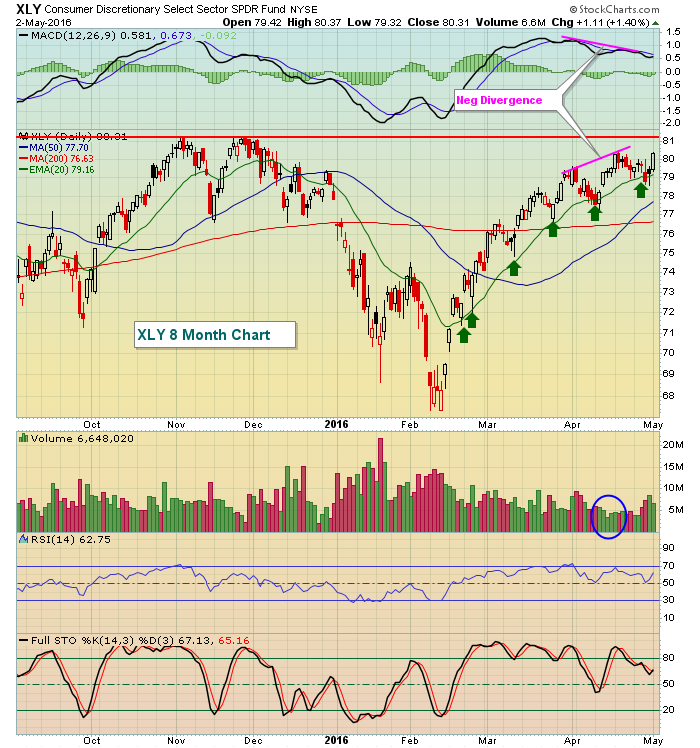 Monday's gains were nice, but the XLY is rapidly approaching major price resistance and doing so with a negative divergence in play. On its most recent price high, the lack of volume could be interpreted as lack of interest as well. Volume improved on yesterday's advance, although we have yet to see the latest breakout and the overhead resistance is still looming.
Crude oil prices ($WTIC) had their most significant decline in the past month and that prompted a selloff in energy shares (XLE) as that sector was the only one in negative territory, ending fractionally lower (-.10%).
Pre-Market Action
Yesterday, the Dow Jones gained 117 points. This morning, Dow futures are down 119 points at last check. Easy come, easy go. Unfortunately, this is the market environment we have. Futures here are being impacted by developments in Asia and across the pond. In Asia overnight, markets were mixed with the Hang Seng ($HSI) down by 1.85% while China's Shanghai Composite ($SSEC) rose by a similar percentage.
Europe is the problem, however, as disappointing bank earnings have sent the Big 3 indices there much lower. The German DAX ($DAX) is down 1.78% while the French CAC ($CAC) is down 1.51% - at last check. U.S. futures are down significantly in sympathy.
Current Outlook
Negative divergences have seemingly put a lid on U.S. equity prices for now as market participants work through slowing momentum and that simply takes time to unwind. On the S&P 500, the recent price high approached earlier price highs in November and that's the top of the current trading range. Recent price lows and the rising 50 day SMA mark the bottom of the current trading range. The 50 day SMA is the likely target after a negative divergence emerges. Here's the current look on the S&P 500:
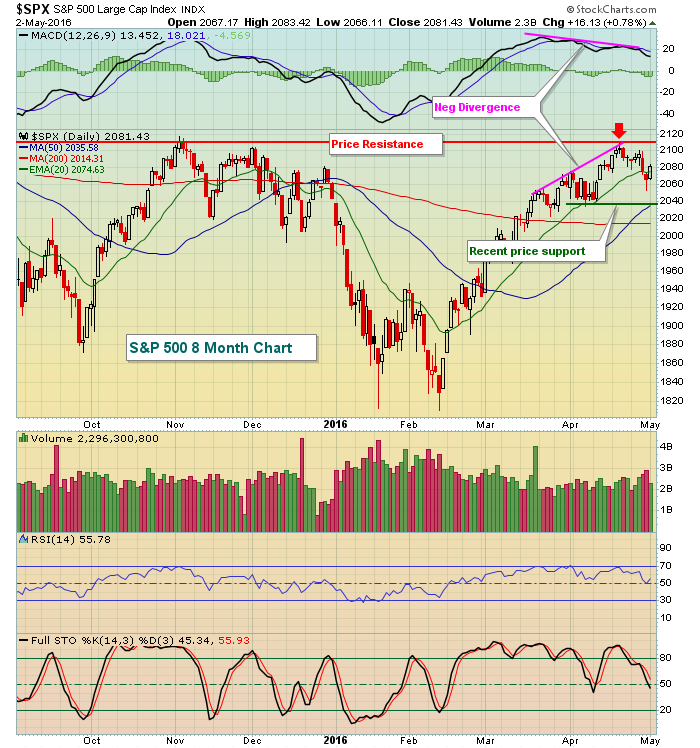 The recent selling and consolidation has also helped to relieve overbought oscillators. Both the RSI and stochastic were overbought two weeks ago but both have now moved in neutral territory. Should the S&P 500 move down to test the bottom of its current trading range, we'll likely see the RSI dip closer to 40 with stochastic possibly moving into single digits. During an uptrend, those levels generally represent solid reward to risk entry.
Sector/Industry Watch
The worst performing industry group over the past week has been consumer electronics ($DJUSCE). For the past six weeks, the DJUSCE has traded mostly sideways, unable to pierce 600 price resistance. And during just the past three trading sessions, it's dropped an astounding 13% or so. The reason? Harman International (HAR). The automotive electronics and audio equipment maker tumbled on massive volume after posting EPS of 1.36, well below the Wall Street forecast of 1.44 per share. Revenues were reported at 1.63 billion, also below 1.70 billion expectations. The market reaction was about as you might expect:
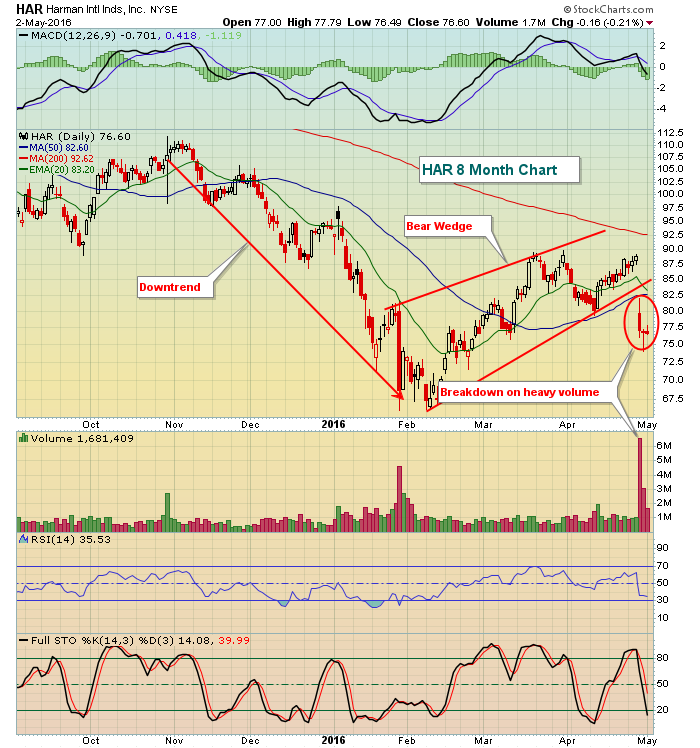 HAR is in need of serious technical repair and until it sees it, the consumer electronics space will continue to suffer.
Historical Tendencies
Since 1987, the Russell 2000's best calendar month performance is December, where it sports an annualized return of +38.49%. February through May make up spots 2 through 5 in terms of calendar month performance. May actually ranks fourth with an annualized return of 15.39%. So while the "go away in May" theory has its merits, leaving the Russell 2000 in May has been a big historical mistake.
Key Earnings Reports
(actual vs. estimate):
CLX: 1.21 vs 1.10
CMI: 1.87 vs 1.77
CVS: 1.18 vs 1.16
EL: .73 vs .60
HAL: .07 vs .04
MYL: .76 vs .75
PFE: .67 vs .55
S: (.14) vs (.13)
VLO: .60 vs .73
(reports after close, estimate provided):
CBS: .94
ILMN: .74
VRSK: .77
Key Economic Reports
None
Happy trading!
Tom


