Market Recap for Friday, April 29, 2016
The U.S. stock market suffered further damage on Friday as all of our major indices ended lower. There were a few bright spots despite the NASDAQ losing more than its fair share and closing at its lowest level in more than a month. Amazon.com's (AMZN) stellar quarterly earnings report provided broadline retailers ($DJUSRB) a huge boost (+4.26%) and helped to send consumer discretionary (XLY +.51%) stocks near the top of the sector leaderboard, trailing only the defensive utilities (XLU +.60%) sector.
Treasuries were under accumulation once again with the 10 year treasury yield ($TNX) falling to 1.82%, its lowest level in more than a week. 1.65%-2.00% is the intermediate-term range to watch. A breakout above 2.00% would be very bullish for equities (as money would clearly be rotating away from the defensive treasuries), while a drop beneath 1.65% would suggest bond traders are hunkering down for a significant slowdown in economic activity.
Semiconductors ($DJUSSC) underperformed badly on Friday and given their recent negative divergence and loss of 50 day SMA support on increasing volume, this is a key industry group to watch. May could be the last hurrah for the group as June and July tend to be very weak relative to other times of the calendar year. Take a look at the current chart, then the seasonality chart of the DJUSSC:
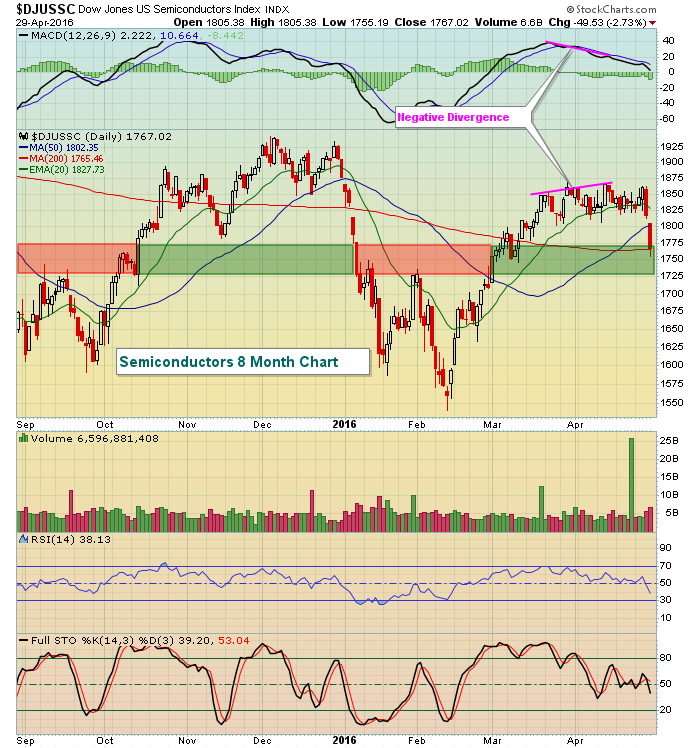 The 1725-1750 support zone needs to hold during May and the DJUSSC could use a little breathing room technically because June and July are not kind to semiconductors historically. Check out the seasonality chart:
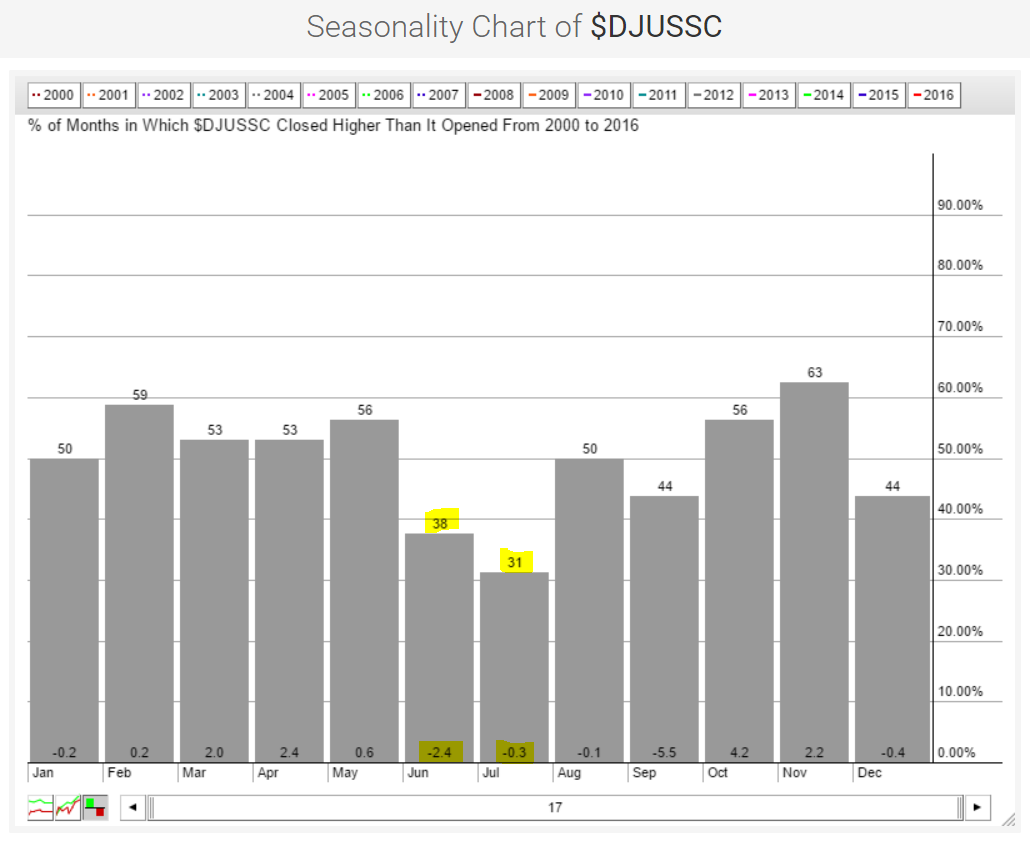 Outside of September, the month of June is the worst for semiconductors with an average absolute return of -2.4% over the past 17 years.
Pre-Market Action
Asian markets were very weak overnight, especially in Tokyo, where the Nikkei ($NIKK) dropped significantly for the second straight session. The NIKK has fallen 1142 points, or roughly 7% in just the past two trading sessions. In addition, China's Shanghai Composite ($SSEC) has been trading back below 3000 and the Hang Seng Index ($HSI) now resides at its rising 20 day EMA.
In Europe, the German DAX ($DAX) is holding above its psychological 10000 level but did close beneath 20 day EMA support on Friday before today's near 1% gain. The French CAC ($CAC) is higher by .50% while the London FTSE ($FTSE) is closed today.
U.S. futures are slightly higher this morning as traders look ahead to the end of week employment report. The first week of calendar months tend to be strong as money inflows tend to drive prices higher. We'll see if that's the case this week, but as you can see below in the Current Outlook section, the NASDAQ is in need of a rally from its current level.
Current Outlook
I've written much about the negative divergences that have been present and the need for 50 day SMA tests to "reset" those MACDs to or near centerline support. Check out how Friday's action did just that on the NASDAQ:
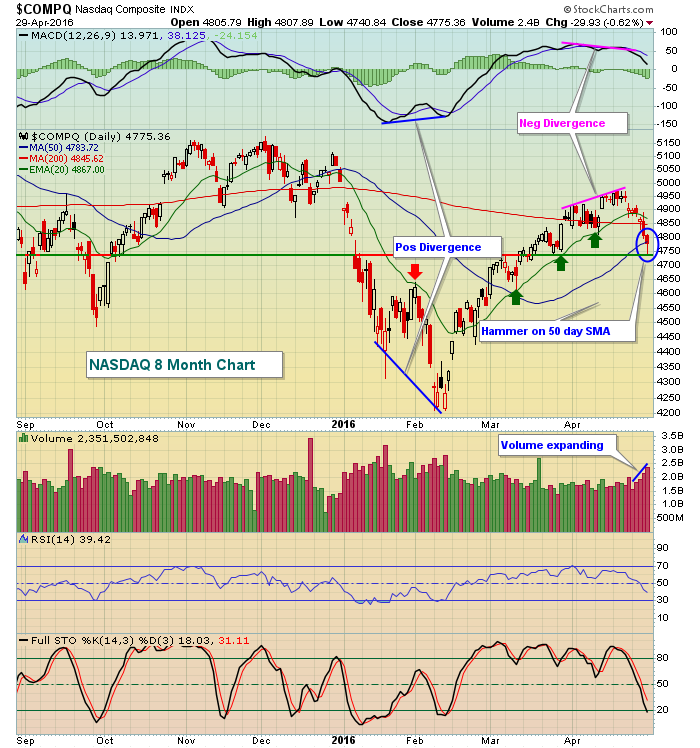 There's plenty to talk about on this chart. As you can see from the above, the positive divergence that formed at February's low marked a significant bottom. Prior to that signal of slowing selling momentum, the declining 20 day EMA served as resistance. After the positive divergence, however, prices moved through 20 day EMA resistance like it didn't matter. Now look at how the top formed. The rising 20 day EMA served as support until.....a negative divergence emerged. Since then, the NASDAQ has struggled and on Friday printed a hammer at 50 day SMA support with the daily MACD falling back near centerline support. When I see positive and negative divergences print, I look for 50 period SMA tests to send MACDs back to or near centerline support/resistance. From there, anything goes. Mostly, they just suggest I not use the 20 period EMAs as the key moving average any longer.
Note also that 4740 marked a January gap level and key pivot area in 2016. Currently, I'd view 4740 as important closing support on the NASDAQ while the recent high candle body just below 5000 as major resistance. I'd look for trading in this range for now.
Sector/Industry Watch
Gambling stocks ($DJUSCA) were on fire until they ran into the month of April. Since April 19th, however, they've fallen from 670 to 586 and testing the March reaction low. The primary reason for the recent selling, in my opinion, was the presence of a negative divergence on the daily chart. That has now played out as the DJUSCA has fallen below its 50 day SMA and its MACD is just beneath centerline support. One of the strongest stocks within the gambling space has been Wynn Resorts (WYNN), which has also given back plenty of its earlier gains. It could be primed for a reversal from the current level, though. Check out WYNN's chart:
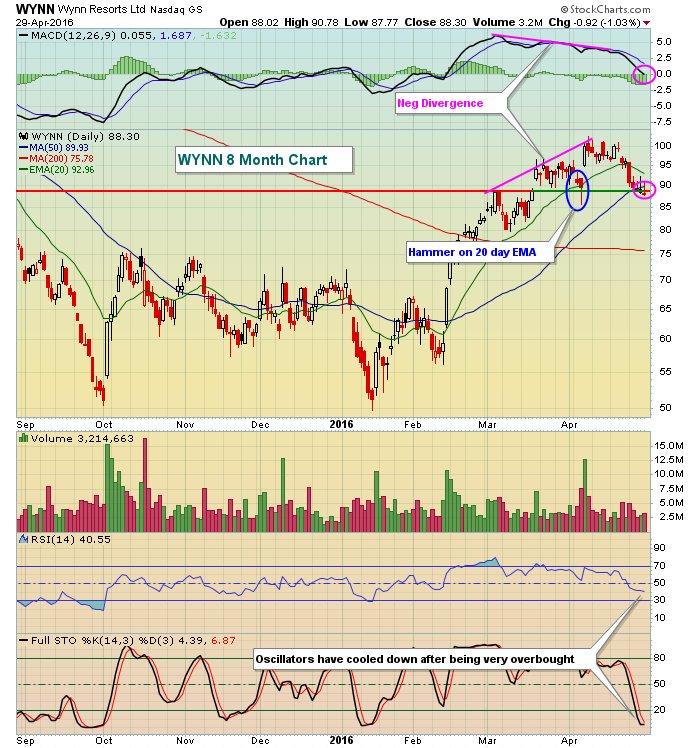 While the weekly chart (not shown above) reflects a possible 20 week EMA test closer to 83, the daily chart above shows that WYNN could turn higher at any time at it's currently testing recent gap and price support in the 88-89 area. Note also that the RSI has dipped back to 40 with stochastic at 4 - perfect levels during an uptrend to enter a stock. This, of course, assumes that the uptrend continues. Therefore a tight closing stop should be considered.
Historical Tendencies
One of the most famous stock market quotes regarding historical performance is "sell in May and go away". Is it fact or fiction? Below is the historical performance of the S&P 500 since 1950, broken down by two periods - May 1st through October 31st and November 1st through April 30th. Here are the annualized returns:
May 1st - October 31st: +3.11% (52.34% of days during this period were higher)
November 1st - April 30th: +14.15% (54.27% of days during this period were higher)
While the disparity is rather obvious, driving home the point, there are periods within the May 1st to October 31st period that are extremely bullish. For instance, May is one of the best calendar months of the year for small cap stocks. And I'd further break down the calendar year to point out the most bearish time, which is from July 18th through September 26th, which carries an annualized return of -2.60%. That covers 3,245 trading days (or roughly 13 calendar years) so certainly is worthy of consideration in terms of trading strategy.
Key Earnings Reports
(actual vs. estimate):
L: .30 vs .52
SYY: .46 vs .42
(reports after close, estimate provided):
AIG: .99
APC: (1.19)
TXRH: .54
VNO: 1.23
Key Economic Reports
April PMI manufacturing to be released at 9:45am EST: 51.0 (estimate)
April ISM manufacturing to be released at 10:00am EST: 51.5 (estimate)
March construction spending to be released at 10:00am EST: +0.5% (estimate)
Happy trading!
Tom


