Market Recap for Thursday, May 5, 2016
The energy sector (XLE) was back on top on Thursday, once again leading the market. The XLE gained .82% as four sectors advanced while five declined. Consumer discretionary (XLY) was the weakest link, dropping .64%. Apparel retailers ($DJUSRA) fell 3.0%, led by Abercrombie & Fitch (ANF) and Buckle (BKE), which were down 5.91% and 5.62%, respectively. The DJUSRA lost short-term support near 780 as reflected below:
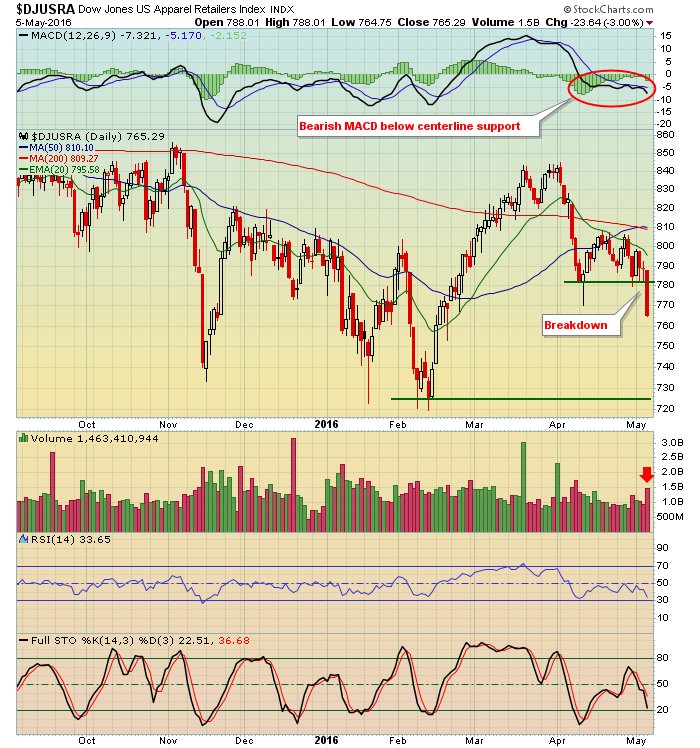 Volume expanded as support failed to hold, which suggests the DJUSRA is now in a lower trading range from 725-782. Note also that recent strength in the second half of April failed at the now-declining 20 day EMA. The combination of price resistance just above 782 and the falling 20 day EMA, currently at 795, should hold the apparel retail bulls at bay.
Biotechs ($DJUSBT) weakened yet again on Thursday and have failed to hold onto their recent breakout level and key pivot area. Check it out:
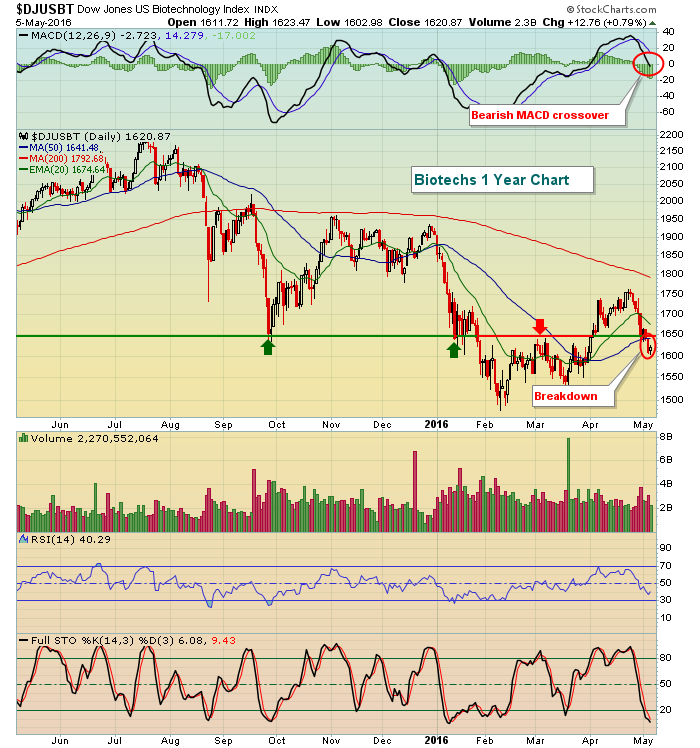 Step one for biotechs will be to clear the 1650 price resistance, then the declining 20 day EMA.
Pre-Market Action
Wednesday's ADP employment report turned out to be a solid indication of what to expect this morning with the government's latest nonfarm payrolls report. The ADP report fell well short of consensus estimates, raising concerns about the strength of our economy. The nonfarm payrolls is underscoring that belief as jobs came in at 160,000, well below the 200,000 that analysts were looking for.
The reaction in the bond market has been about what you might expect - falling yields. The 10 year treasury yield ($TNX) has fallen back to 1.72% and is now perilously close to 1.65% closing yield support, which you can readily see from the line chart (line charts connect closing prices and ignore intraday movements) below:
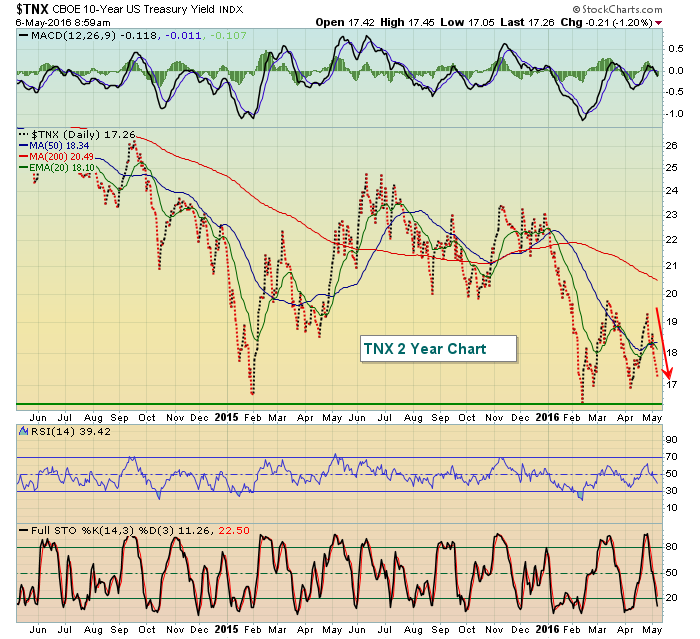 The steady decline in treasury yields the past few weeks has suggested that we be very cautious regarding the S&P 500 rally. Why? Because money flowing into treasuries, which sends the corresponding yields lower, tells us that the bond market is anticipating economic weakness ahead. Economic weakness translates into stagnating, or lower, earnings and that, in turn, impacts negatively U.S. equities.
Current Outlook
The S&P 500 clearly had momentum issues in the form of negative divergences, but the recent selling has helped to alleviate those problems. Now, I'd keep a close eye on price support and that's approaching as you can see from the chart below:
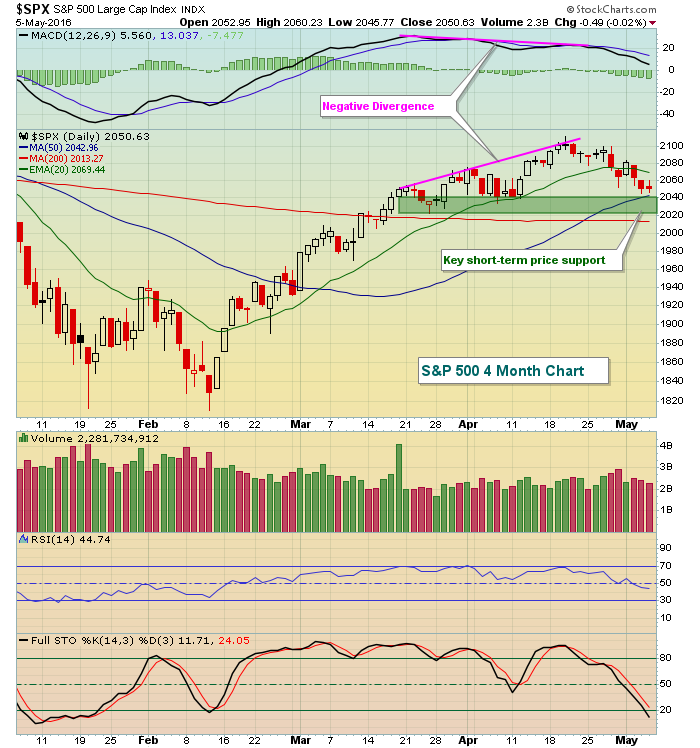 One signal of a potential bottom after this downtrend would be a close that's well above intraday lows and on higher volume. 2.7 - 3.0 billion shares would be solid volume to look for.
Sector/Industry Watch
After struggling with a negative divergence and nearly testing its 50 day SMA, the Dow Jones REIT Index ($DJR) has been on a roll. It's clear that traders are flocking to defensive, high-yielding REITs as treasury yields have plunged. Here's a very short-term view at the breakout in the DJR as the 10 year treasury yield ($TNX) falls:
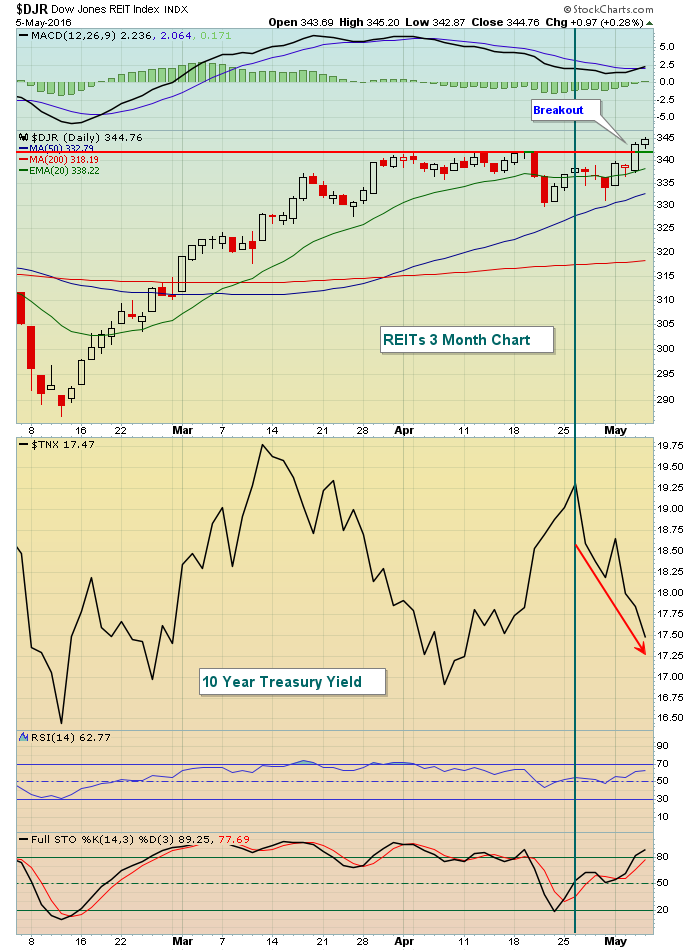 The MACD began rolling over in mid-April while the DJR continued to set new price highs. That sign of slowing momentum resulted in the DJR sideways consolidating for the next few weeks, just prior to the recent breakout. Momentum is not an issue any longer and I'd expect to see higher prices in the days and weeks ahead.
Historical Tendencies
Since 1950 on the S&P 500, May 6th through May 25th has been a very bearish period, producing annualized returns of -13.81%, which is nearly 23 percentage points lower than the average annual return throughout the year of +9%.
Key Earnings Reports
(actual vs. estimate):
CI: 2.32 vs 2.17
WY: .24 vs .20
XRAY: .69 vs .63
Key Economic Reports
April nonfarm payrolls released at 8:30am EST: 160,000 (actual) vs. 200,000 (estimate)
April private payrolls released at 8:30am EST: 171,000 (actual) vs. 195,000 (estimate)
April unemployment rate released at 8:30am EST: 5.0% (actual) vs. 4.9% (estimate)
April average hourly earnings released at 8:30am EST: +0.3% (actual) vs. +0.3% (estimate)
April average workweek released at 8:30am EST: 34.5 (actual) vs. 34.5 (estimate)
Happy trading!
Tom


