Market Recap for Tuesday, July 19, 2016
The Dow Jones managed to close at another all-time high on Tuesday despite seven of nine sectors falling. Most of the weakness, however, was confined to materials (XLB, -0.59%) and energy (XLE, -0.56%). None of the other sectors fell more than 0.22%. The two gainers included industrials (XLI, +0.05%) and financials (XLF, +0.04%) with REITs particularly strong within the financial sector. Six of the top seven industry groups within financials were REITs with the Dow Jones U.S. Hotel & Lodging REITs ($DJUSHL) leading the pack. This industry group has reversed its longer-term downtrend and appears poised for future strength. Take a look:
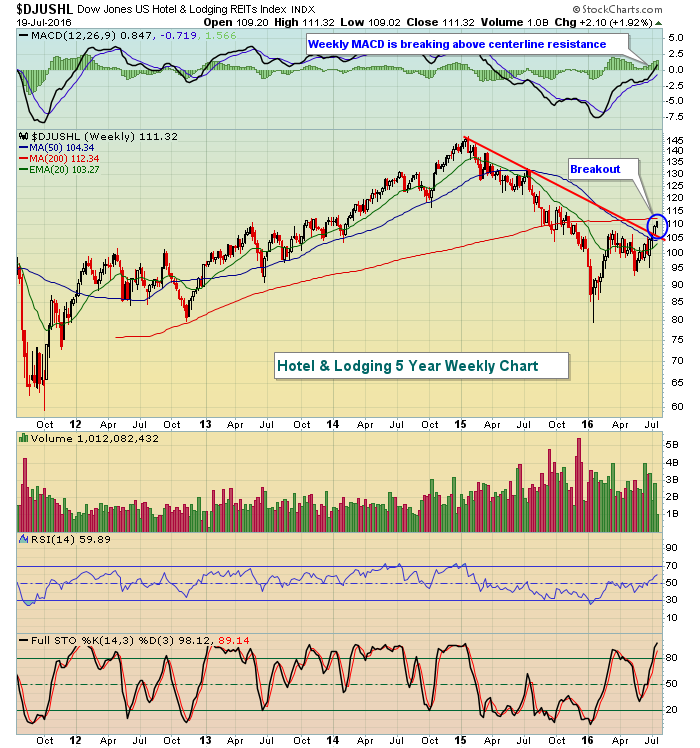 The 115-120 area should prove to be formidable initial resistance, but eventually I'd expect to see this index much higher.
Pre-Market Action
Global indices are mostly higher as they attempt to clear gaps established from Brexit. The German DAX is the perfect example as a push above 10250 would do the trick. Check it out:
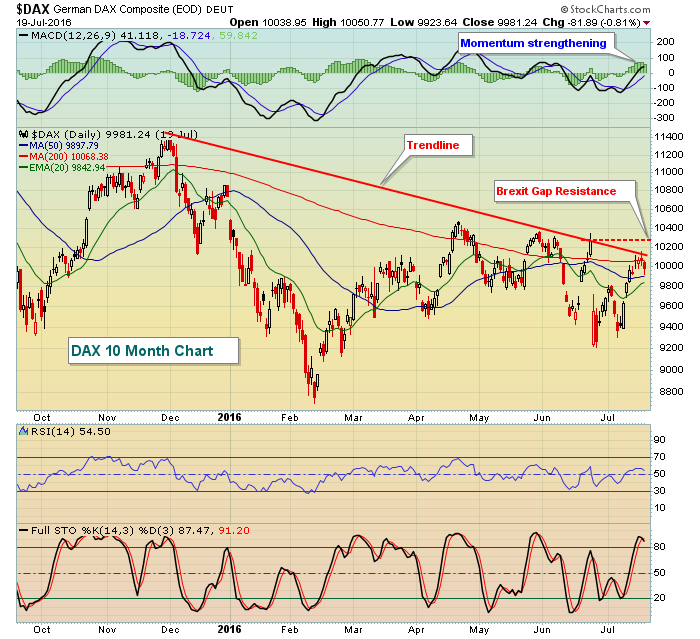 A move through 10250 would clear gap resistance, but it also would eclipse trendline resistance in the process - a double win.
U.S. futures are once again following the lead of global markets with the Dow Jones futures up 46 points less than 10 minutes before the market open. The 10 year treasury yield ($TNX) is up to 1.58% and a continuing push higher there would likely benefit U.S. equities.
Current Outlook
The Volatility Index ($VIX) closed below 12 on Tuesday for the first time since July 17, 2015, or just over a year. Low volatility suggests the continuation of a bull market. As long as the VIX remains below 15, it's going to be very difficult for the bears to gain any traction whatsoever. While many might continue to believe we're heading for a bear market, the low VIX suggests otherwise. In my opinion, we need to see a price breakdown before growing bearish. In the meantime, the poor overall sector rotation since April simply paints a "cautiously bullish" picture. A price breakdown and rising VIX is required to turn bearish. Here's a look at the VIX since the 2007 top:
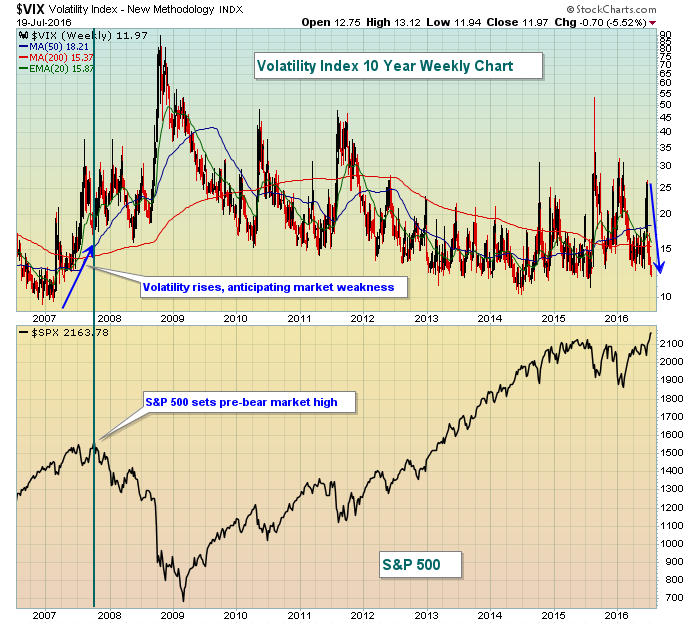 While the VIX is not a guaranteed way to predict future stock market performance, it does occasionally provide us advanced signals that we should respect. Look back to 2007. The S&P 500 was sailing along in terms of price action, only to see expected volatility rising. In my view, that was a warning sign. At that time, we also had very poor rotation among sectors and key industry groups.
Currently, the VIX below 12 makes it difficult to be bearish - at least in terms of expected market volatility.
Sector/Industry Watch
Industrial stocks (XLI) have made a significant leap above key resistance levels and are now trailing only materials (XLB) and energy stocks (XLE) in terms of SCTR ranking. The breakout was made at 57 and now the XLI is comfortably (approximately 3%) above this initial price support. Check it out:
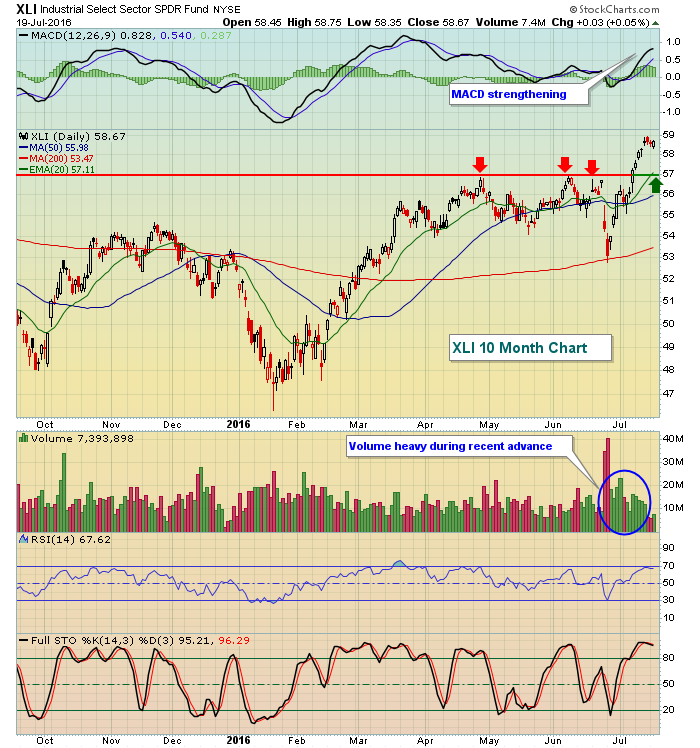 Note also that the rising 20 day EMA (green arrow) resides at price support as well. Volume has been strong throughout this advance, indicative of accumulation. This strength comes despite relative weakness in certain transportation ($TRAN) areas like airlines ($DJUSAR) and trucking ($DJUSTK).
Historical Tendencies
Once we move past the current bearish historical period (July 18th through July 24th), the S&P 500 tends to perform quite well through August 2nd with an annualized return of 19.38% (roughly double the normal 9% return enjoyed throughout the year) for that 9 calendar day period.
Looking further ahead, August is not a good month overall with a calendar month rank of 11 (out of 12) with only September producing worse historical results.
Key Earnings Reports
(actual vs. estimate):
ABT: .55 vs .53
HAL: (.14) vs (.19)
ITW: 1.46 vs 1.40
MS: .75 vs .60
(reports after close, estimate provided):
AXP: 1.92
EBAY: .36
FFIV: 1.38
INTC: .54
MAT: (.06)
NEM: .28
QCOM: .83
SAP: .78
TSCO: 1.16
Key Economic Reports
None
Happy trading!
Tom