Market Recap for Wednesday, July 20, 2016
Technology (XLK, +1.31%) had another huge day on Wednesday as consumer electronics ($DJUSCE) and software ($DJUSSW) paced the advance. It didn't hurt that biotechs ($DJUSBT) were up more than 1.50%, leading healthcare to outsized gains as well. But let's get back to technology and the breakout that this aggressive sector is now enjoying. Take a look below:
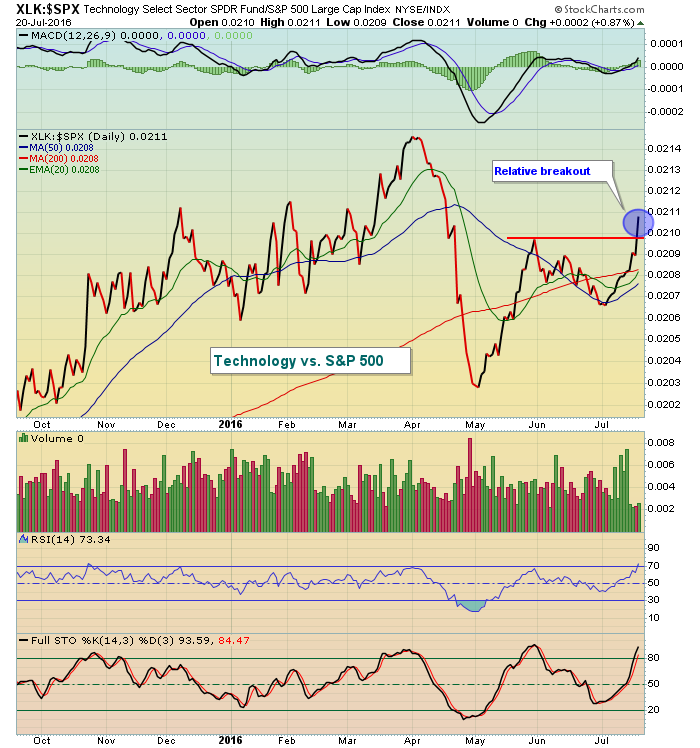
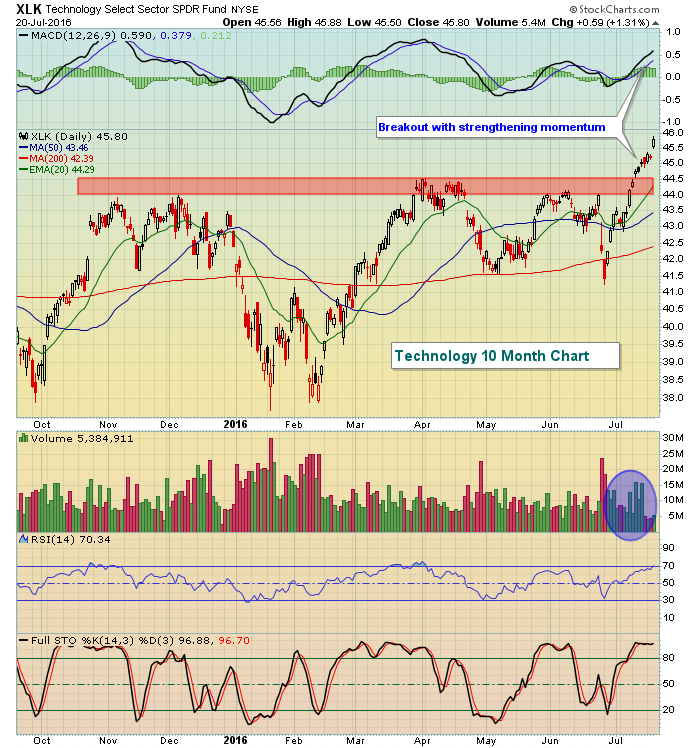 Momentum is strengthening in terms of price action (MACD) and volume has also picked up on the recent push higher. Over the past month, the XLK has gained nearly 6%, leading all sectors. It's just broken out to a three month relative high vs. the benchmark S&P 500 as well. Check this out:
 Six of the nine sectors finished higher on Wednesday with mostly weakness in defensive sectors as utilities (XLU, -0.58%) and consumer staples (XLP, -0.36%) were the primary laggards.
Pre-Market Action
This morning, the 10 year treasury yield ($TNX) is at its highest level (1.61%) since the fallout from Brexit. While this remains historically low, the trend higher in the TNX off the low at 1.34% is helping more money flow towards equities and keeping this bull market rally alive.
Global markets were mixed with strength in Asia overnight while we're seeing fractional losses in Europe currently. Dow Jones futures are showing slight weakness as they're down 31 points at last check.
Current Outlook
This morning, the 10 year treasury yield ($TNX) is at its highest level (1.61%) since the fallout from Brexit. While this remains historically low, the trend higher in the TNX off the low at 1.34% is helping more money flow towards equities and keeping this bull market alive. It's also encouraging to see leadership emerge from areas like technology with both internet and software stocks pushing to new highs. It should also be noted that semiconductors ($DJUSSC) are at their 52 week high and on the cusp of another key breakout. Check out the DJUSSC long-term weekly chart:
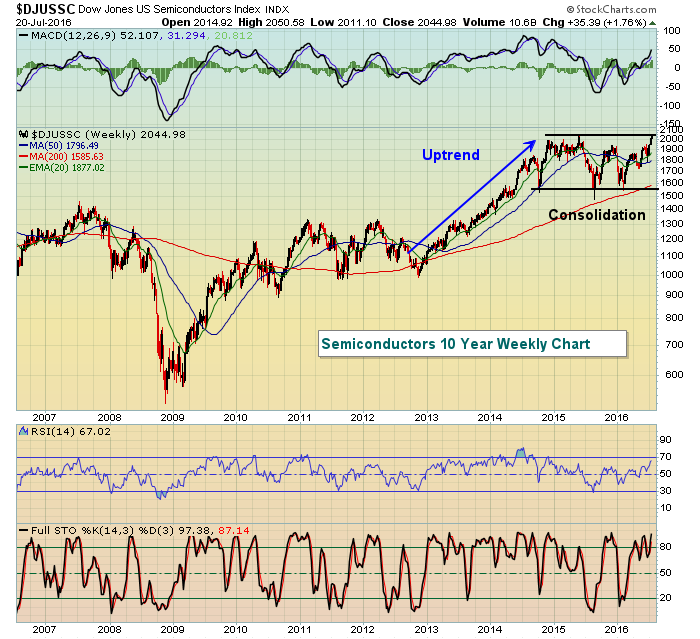 This is the next technology industry group awaiting a breakout. The more groups that break out, the more groups where technical dollars will flow. Clearly, a breakout here would be significant. Unfortunately, Intel's (INTC) quarterly results after the bell on Wednesday disappointed traders so the bulls will have an uphill climb from here.
Sector/Industry Watch
Consumer electronics ($DJUSCE, +3.09%) and software ($DJUSSW, +2.93%) both had big days on Wednesday to help lead the technology-driven rally. While the DJUSCE has been mostly mired in a downtrend since topping in April 2015, the DJUSSW has been a relative leader and finally broke out above 1250 after consolidating and hitting key price resistance at that level for months. Here's the technical view:
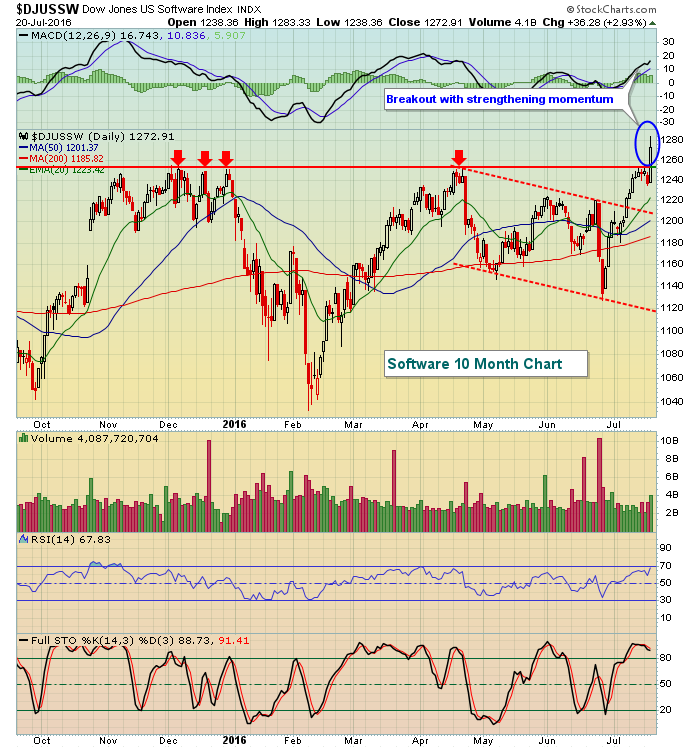 As long as the uptrend in the S&P 500 continues, it would appear that software should be an area to consider for long positions now that this multi-month long consolidation period has been broken to the upside.
Historical Tendencies
Since 1987, the Russell 2000 has produced annualized returns of -6.69% during the month of July, ranking July as the 10th best calendar month of the year. Its dismal July results do still beat August and October, which produce annualized returns of -8.04% and -7.73%, respectively. September has an annualized return of -1.77%, which means that small cap stocks have averaged going down each of the four consecutive calendar months from July through October.
Key Earnings Reports
(actual vs. estimate):
ADS: 3.28 vs 3.32
BIIB: 5.21 vs 4.69
BK: .76 vs .75
DHI: .66 vs .66
GM: 1.86 vs 1.47
LUV: 1.19 vs 1.22
SLB: vs .22 (awaiting actual numbers)
TRV: 2.20 vs 2.12
(reports after close, estimate provided):
CMG: 1.04
COF: 1.86
SBUX: .49
T: .71
V: .67
Key Economic Reports
Initial jobless claims released at 8:30am EST: 253,000 (actual) vs. 265,000 (estimate)
July Philadelphia Fed Business Outlook Survey released at 8:30am EST: -2.9 (actual) vs. 5.0 (estimate)
May FHFA home price index to be released at 9:00am EST: +0.4% (estimate)
June existing home sales to be released at 10:00am EST: 5,475,000 (estimate)
June leading indicators to be released at 10:00am EST: +0.3% (estimate)
Happy trading!
Tom
