Market Recap for Tuesday, July 26, 2016
Commercial vehicles & trucks ($DJUSHR) surged 3.34% on Tuesday, leading a rally in industrials (XLI, +0.83%) that once again sustained the advance in the benchmark S&P 500 despite weakness during the first couple hours of the trading session. The 10 year treasury yield ($TNX) began strengthening in the morning session, rising from an intraday low below 1.55% to a later high near 1.59%. That selling of treasuries ahead of today's FOMC announcement seemed to spur equity buyers as the S&P 500 rallied just after the treasury selling began. Both bond and equity markets are awaiting the latest from the Federal Reserve and they'll get just that at 2pm EST this afternoon.
Leading the DJUSHR was Caterpillar (CAT), which posted better than expected quarterly earnings results before the opening bell on Tuesday and was rewarded with a heavy volume breakout after recent consolidation between 70-80. This should bode well for CAT in the near-term as you can see below:
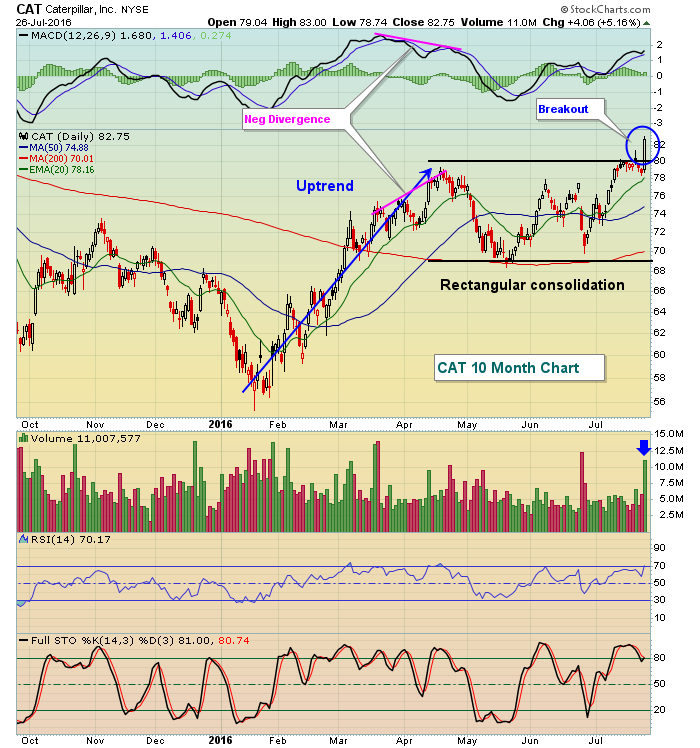 CAT's action has been mostly according to technical plan. The uptrend that began in January ran out of steam in April in terms of both price and volume momentum. That led to a period of consolidation, which was broken on Tuesday on heavy volume and solid fundamental news.
Trailing the action on Tuesday were the defensive sectors as utilities (XLU, -0.87%) and consumer staples (XLP, -0.78%) were both overlooked in favor of their other more aggressive counterparts.
Pre-Market Action
Apple (AAPL) is giving the market a lift in pre-market, especially the NASDAQ, after posting a quarterly report that traders are rallying around. AAPL is trading up 8% currently and threatening to break out above trendline resistance in addition to recent price highs. Let's see what type of candle prints, but any type of hollow candle (close above open) would likely be a precursor to higher prices.
Dow Jones futures are higher by 62 points as the U.S. market continues to try to keep this rally going. Overnight, action in Asia was mixed, but in Europe we're seeing further strength in Germany as the DAX is moving closer and closer to a very critical area of price resistance from 10400-10500. A close above this level would bode well for S&P 500 shares as there's been a very strong positive correlation between these two indices for many years.
Current Outlook
We've been consolidating for nearly two weeks as the latest FOMC announcement approaches. In addition, we've seen mixed reactions to various quarterly earnings reports, although most of the big names have reported earnings that have beaten consensus estimates. Prices tend to gravitate towards either key price support or key price resistance just prior to the FOMC announcement. So looking at the near-term picture on the S&P 500, these are a couple key levels to watch as 2pm EST nears:
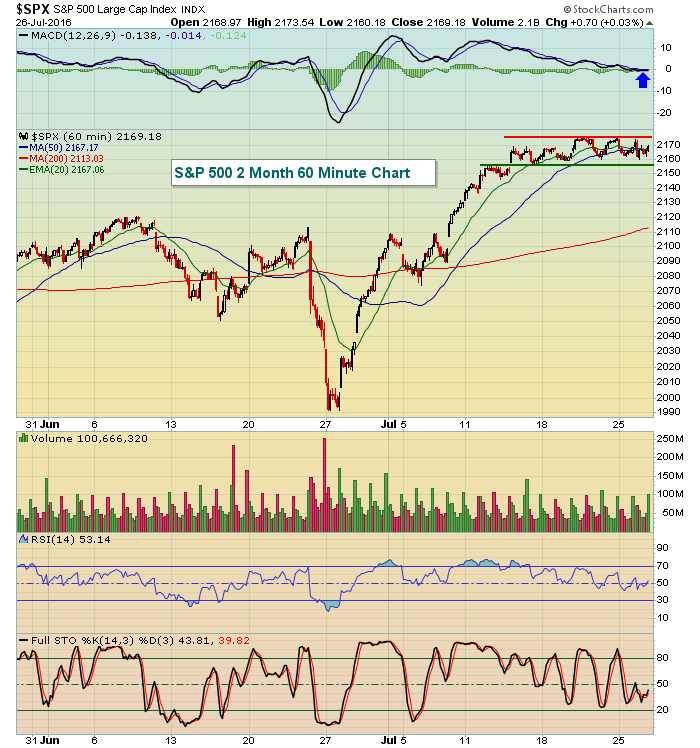 We've seen a huge runup in prices post-Brexit and this pattern is bullish. I'd look for price action intraday today to remain in the 2155-2175 trading range that we've seen the past two weeks. Once the FOMC releases their policy statement, however, it will be important to see if we get a breakout to extend the current uptrend or if we fail to hold 2155 after this lengthy period of consolidation.
Sector/Industry Watch
In addition to commercial vehicles featured above in the Market Recap section, aerospace ($DJUSAS) was a second industrial group that saw a significant breakout and they also were led by a strong quarterly earnings report from a very influential member of the Dow Jones - United Technologies (UTX). Here's a view of the longer-term picture for this group:
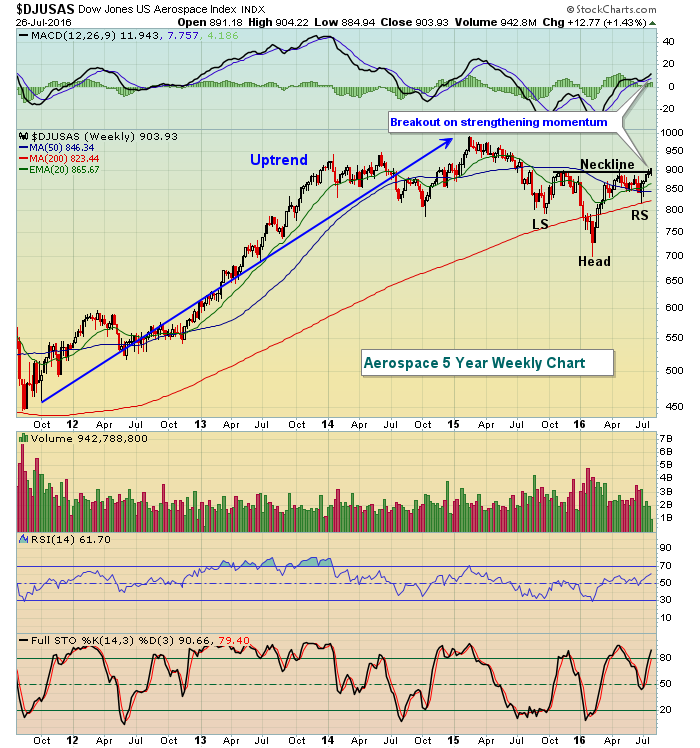 Based on this bullish technical breakout, I'd expect to see continuing relative strength from aerospace stocks over the summer. One headwind for the group will be seasonality as the August through October period has been flat on average over the past twenty years.
Historical Tendencies
The Russell 2000 does not follow the bullish tendencies of the S&P 500 and NASDAQ as July moves into August. In fact, beginning July 31st, this small cap index has negative annualized returns for each day through August 6th. That's highly unusual as the first six days of ALL calendar months have produced solid gains despite the early August weakness.
Key Earnings Reports
(actual vs. estimate)
BA: (.44) vs .71 (not sure if these two numbers are comparable because BA had a large write-off)
CMCSA: .83 vs .82
DPS: 1.25 vs 1.19
GD: 2.44 vs 2.30
GRMN: .87 vs .67
GT: 1.16 vs 1.04
KO: .60 vs .58
NOC: 2.60 vs 2.50
WM: .74 vs .71
(reports after close, estimate provided):
AMGN: 2.74
CA: .56
FB: .62
LRCX: 1.64
ORLY: 2.67
UNM: .94
WFM: .37
XLNX: .55
Key Economic Reports
June durable goods released at 8:30am EST: -4.0% (actual) vs. -1.3% (estimate)
June durable goods ex-transports released at 8:30am EST: -0.5% (actual) vs. +0.3% (estimate)
June pending home sales to be released at 10:00am EST: +1.3% (estimate)
Happy trading!
Tom


