Market Recap for Monday, July 25, 2016
It was a quiet session for most areas of the market. Consumer discretionary (XLY, +0.16%) was the only sector to finish in positive territory, but most of the other sectors lost fractional amounts and it did little to change their technical pictures or outlooks. Energy (XLE, -1.99%), however, tumbled as crude oil prices ($WTIC) continue to weaken. The XLE closed beneath its 50 day SMA for only the second time since it bottomed in February. On the surface, that might appear to be weak technically - and it is - but the longer-term chart still remains bullish as you can see below:
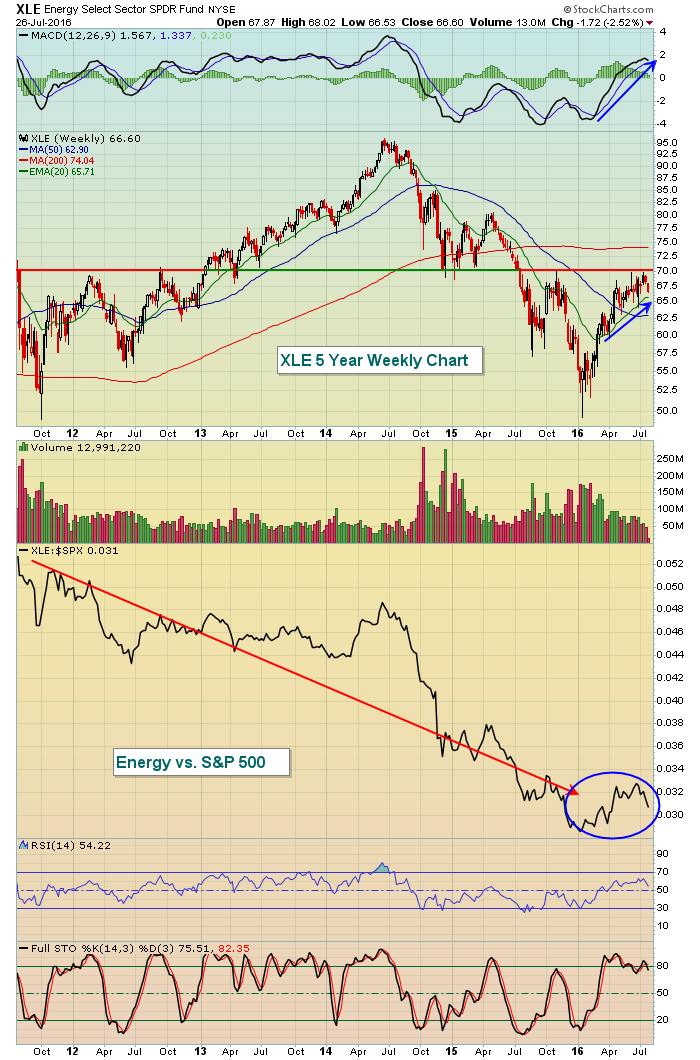 The 18 month downtrend was broken in 2016 and the current absolute performance has been strong with rising 20 week EMA support holding on each pullback. Also, the XLE has been outperforming the S&P 500 (blue circle) on a relative basis in 2016, although we've seen relative weakness since crude oil topped just above $50 per barrel.
Pre-Market Action
It's another boring day as we await the latest FOMC policy statement on Wednesday. Dow Jones futures are currently down 13 points. Action was mixed in Asia overnight and gains are fractional in Europe this morning.
Earnings are beginning to pour in and with mixed results. McDonald's reported very poor results, missing their EPS estimate by a wide margin with the stock down 2.7% in pre-market trading. Meanwhile, Caterpillar (CAT) posted a solid earnings beat and is down in reaction and Sirius Satellite (SIRI) missed its EPS estimate by a penny yet is currently trading in all-time high territory as we get set to open for trading.
Current Outlook
While we remain in breakout territory, the gains the past several days have been shallow. On the S&P 500, for instance, we have traded between 2155.79 and 2175.63 for the past eight trading sessions. That's a mere 1% trading range. So while it's bullish to see the breakout above 2131 finally occur, traders have not been rushing into stocks. In fact, much of the gains since the breakout have been on opening gaps higher. Look at this intraday chart of the SPY (ETF that tracks the S&P 500):
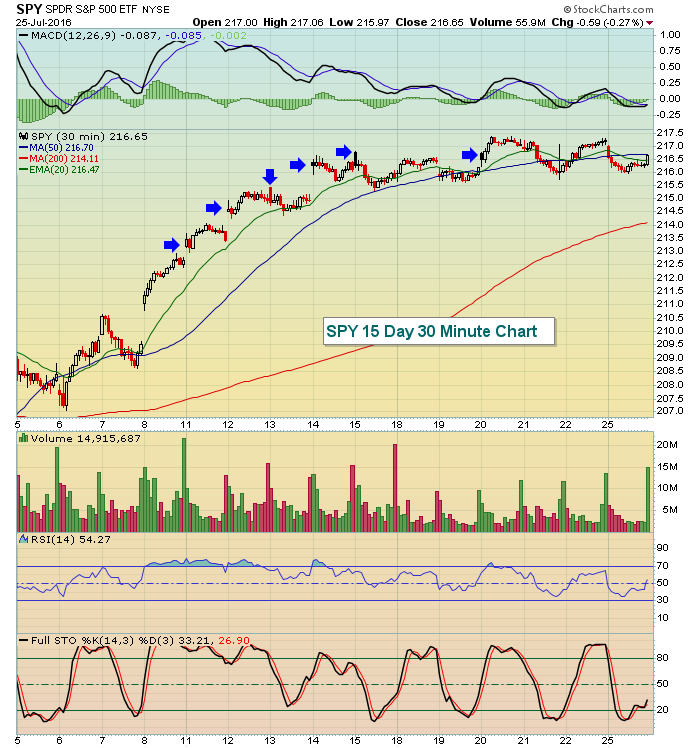 The significance is that once the stock market opens, there's been very little accumulation of U.S. stocks. Those blue arrows point to repeated opening gaps higher, only to see equities waffle throughout the trading day. Here's an interesting fact. Since the July 8th close at 2129.90 (the last close beneath 2131), the S&P 500 has gained 38.58 points, but only 2.60 points have been "earned" during the trading day. 35.98 of the gains have been generated by opening gaps higher. It just seems odd to me that there's been little intra-session buying after a breakout to an all-time high.
Sector/Industry Watch
Well, there are at least two key fundamental pieces that traders are watching closely today and tomorrow - Apple's (AAPL) earnings after the bell tonight and the FOMC announcement on Wednesday at 2pm EST. With respect to AAPL, below is a chart and the key short-term support and resistance numbers to watch. An open tomorrow above resistance would be bullish while an open below support would be bearish. Check it out:
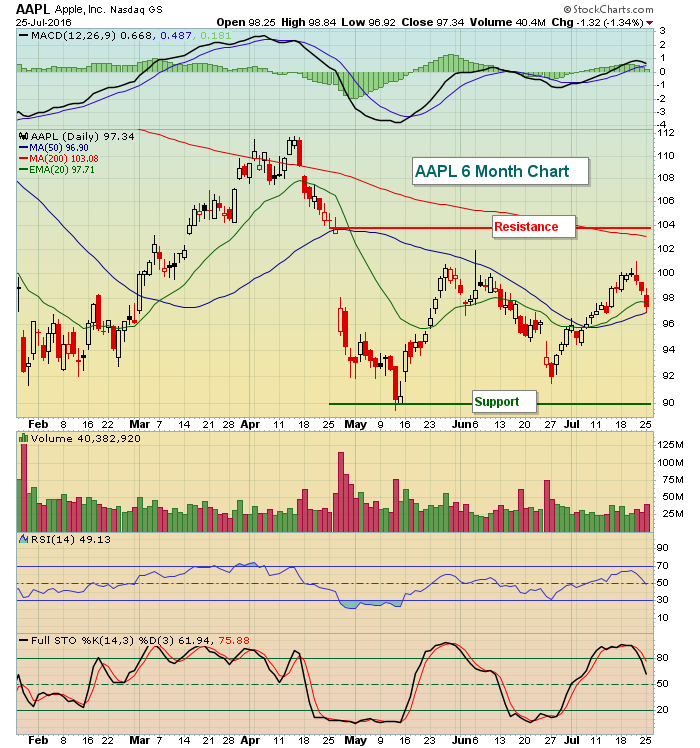 AAPL's results will clearly have a major impact on technology in general and, more specifically, computer hardware ($DJUSCR). Currently, its price resides in a fairly wide 90-104 trading range and Monday's close was squarely in the middle of it. Though not shown above, keep in mind that AAPL has long-term price support in the 90-93 area and has been struggling in a downtrend for a year now. A close above 104 would also break this downtrend and would be very bullish for AAPL.
Historical Tendencies
The NASDAQ has produced annualized returns of 19.84% on the 26th calendar day of all months since 1971 making it the 10th best day of the calendar month to be long NASDAQ stocks.
Key Earnings Reports
(actual vs. estimate):
AVY: 1.09 vs 1.01
BP: .23 vs .26
CAT: 1.09 vs .96
DD: 1.24 vs 1.10
FCX: (.02) vs (.01)
LLY: .86 vs .85
MCD: 1.25 vs 1.38
MMM: 2.08 vs 2.08
SIRI: .03 vs .04
UA: .01 vs .01
UTX: 1.82 vs 1.65
VZ: .94 vs .94
(reports after close, estimate provided):
AAPL: 1.39
AKAM: .50
BWLD: 1.26
CTXS: .92
EW: .70
ILMN: .73
JNPR: .37
PNRA: 1.75
TWTR: (.15)
Key Economic Reports
May Case Shiller home price index released at 9:00am EST: -0.1% (actual) vs. +0.4% (estimate)
June new home sales to be released at 10:00am EST: 562,000 (estimate)
July consumer confidence to be released at 10:00am EST: 96.0 (estimate)
Happy trading!
Tom


