Market Recap for Thursday, July 28, 2016
The action on Thursday was different than what we've seen recently as investor focus seemed to turn to safety ahead of the GDP report and after the FOMC announcement on Wednesday. Consumer staples (XLP, +0.44%) and utilities (XLU, +0.39%) led the six advancing sectors while basic materials (XLB, -0.14%) was the worst performing sector.
The Dow Jones U.S. Brewers Index ($DJUSDB) was primarily responsible for the relative strength of consumer staples as the group jumped nearly 5% to apparently nix the idea of a head & shoulders breakdown from Wednesday. Check out this reversal:
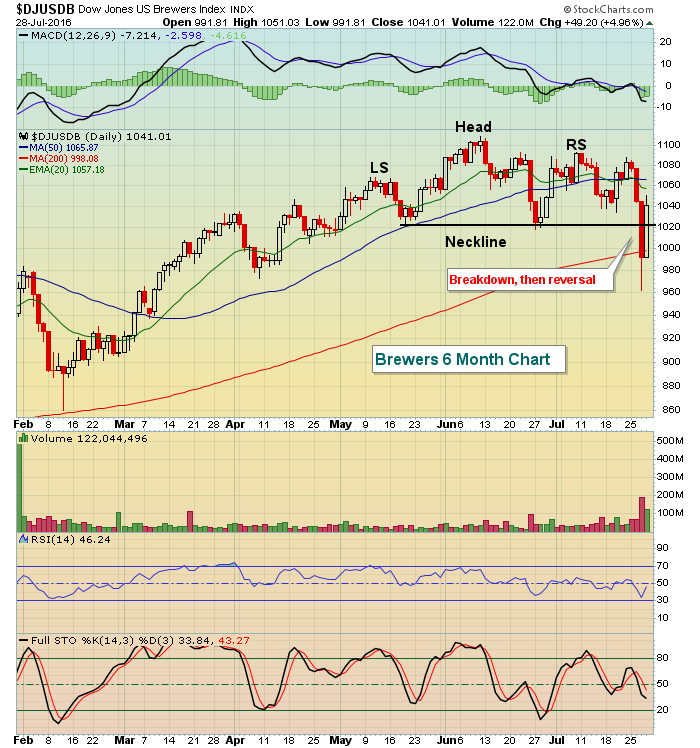 Recovering back above neckline resistance is important but occasionally that occurs only to later see failure at the declining 20 day EMA. For the DJUSDB, that 20 day EMA is currently at 1057. Moving back above that key moving average would add further bullishness to yesterday's reversal.
Pre-Market Action
Well, the news in pre-market trading is throwing the proverbial "kitchen sink" at the bulls. Thus far, the S&P 500 has held up well despite many reasons that could warrant a selloff. But huge earnings misses by several big names, including energy giant Exxon Mobil (XOM), and a Q2 GDP report that was less than half of forecast will challenge the bulls' will.
The good news, at least initially, is the reaction in the bond market to the weak GDP number. The 10 year treasury yield ($TNX) was flat this morning - at last check - as money has not exactly flocked to safety after the economic miss.
Lexmark (LXK), Cigna (CI) and Anheuser-Busch (BUD) all missed consensus EPS estimates this morning. The NASDAQ, however, should get a lift from solid results and positive reactions to both Amazon.com (AMZN) and Alphabet (GOOGL), which reported quarterly results after the bell on Thursday.
Dow Jones futures are down 43 points this morning as all of the earnings news and the GDP miss sink in.
Current Outlook
The financial sector could hold the key as the Dow Jones U.S. Financials Index ($DJUSFN) is at key price resistance and in a relative downtrend vs. the S&P 500. Here's the current technical state:
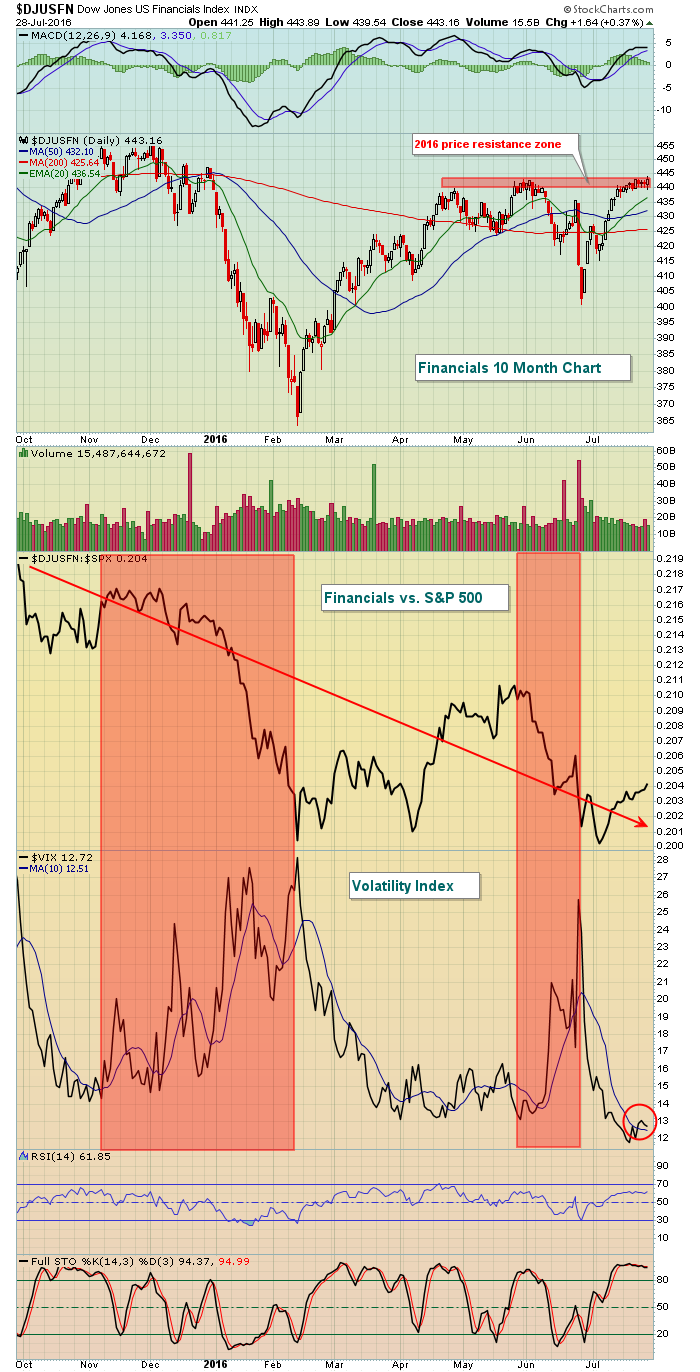 A few points here. First, note that the 440-445 range has served as resistance on the past few rallies. So there's price resistance to deal with. Also note that financials, on a relative basis, have been underperforming the S&P 500 throughout much of the past ten months. But what's really interesting is that when fear escalates (VIX trends higher), the relative performance of financials really turns sour. At the bottom of the VIX chart, you can see that it's recently rose above its 10 day SMA, a potential signal to run for cover on the financials. This bull market has been incredibly resilient and perhaps this will be one more time where the bulls squash a potential threat, but I'd at least be cautious with the financials at this critical price resistance area. The reaction to today's Q2 GDP report will be important because if the 10 year treasury yield ($TNX) turns down again, there'll be fundamental pressure on bank earnings and that could trigger another period of underperformance by the financials.
Sector/Industry Watch
The Dow Jones U.S. Soft Drinks Index ($DJUSSD) has been struggling recently and underperforming the S&P 500, but this could begin to change as trendline support and the 50 day SMA have just been tested. Here's the current look:
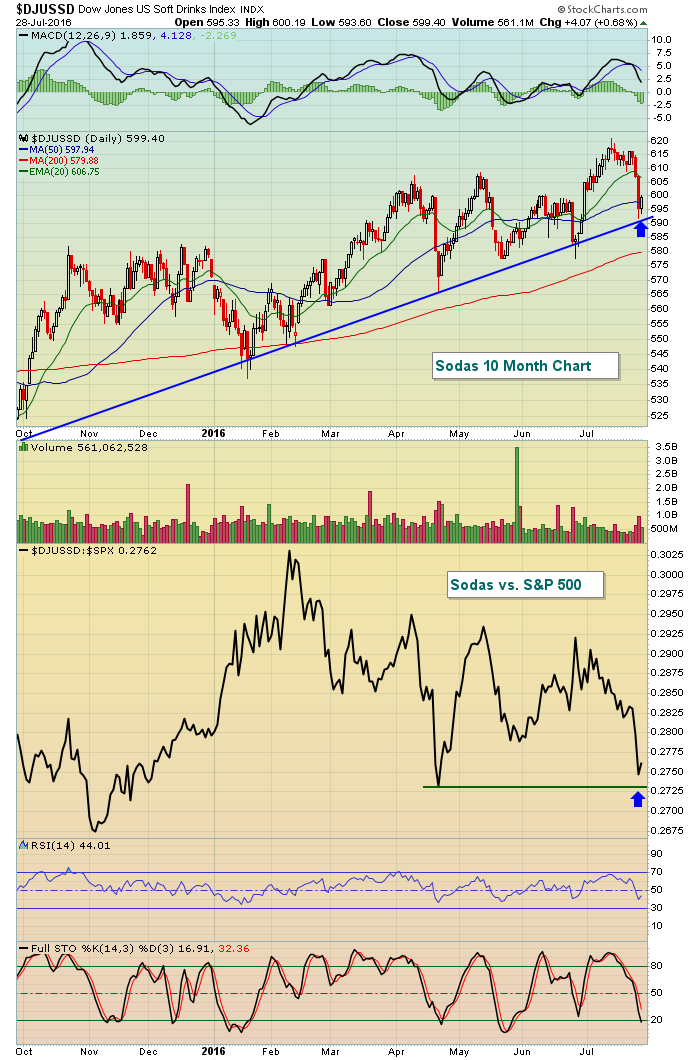 Note also that relative support from April is nearing. This would represent a technical area where we'll begin to see sodas outperform. And the fact that trendline support is being tested adds to that likelihood.
Historical Tendencies
The Russell 2000 does not have a strong track record in August as the chart below highlights:
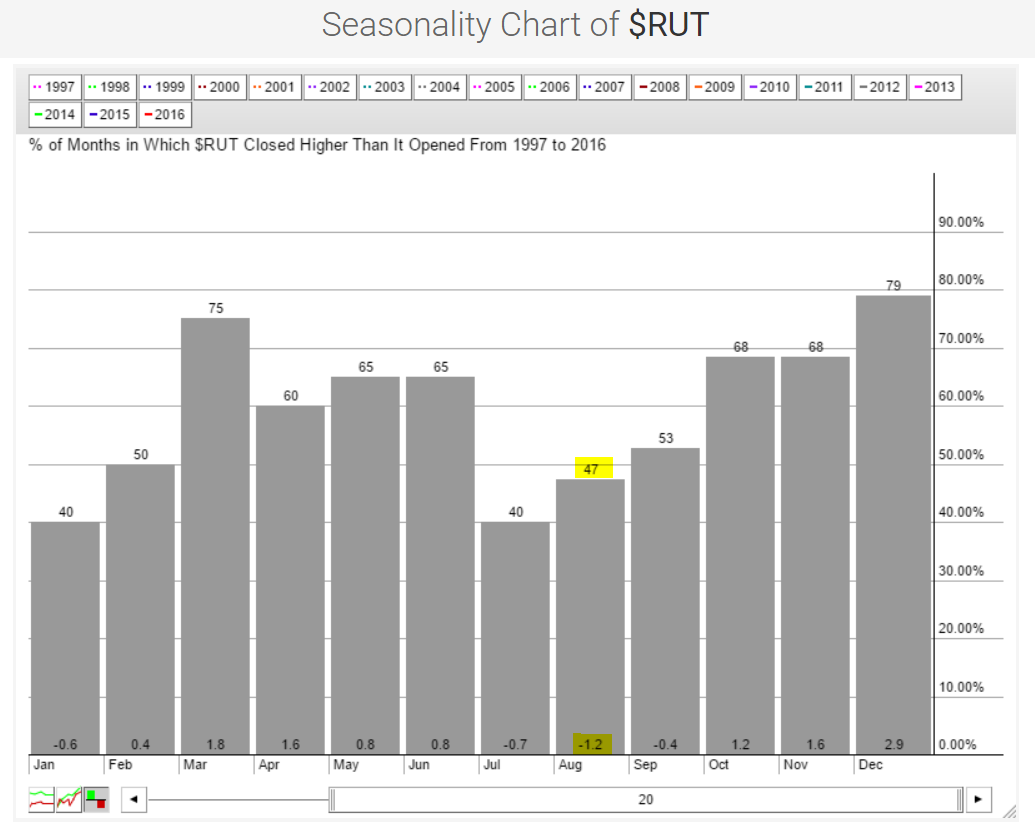 Over the past twenty years, the average return during August is -1.2% - the worst among all calendar months. And it's history of rising during August just 47% of the time beats only January and July. So the current small cap absolute and relative rally is facing historical headwinds beginning Monday.
Key Earnings Reports
(actual vs. estimate):
BUD: 1.06 vs 1.09
CI: 1.98 vs 2.39
CVX: .49 vs .31
LXK: .69 vs .82
MRK: .93 vs .92
NWL: .78 vs .73
TYC: .54 vs .53
UPS: 1.43 vs 1.43
XOM: .41 vs .64
Key Economic Reports
Q2 GDP released at 8:30am EST: +1.2% (actual) vs. +2.6% (estimate)
July Chicago PMI to be released at 9:45am EST: 54.0 (estimate)
July consumer sentiment to be released at 10:00am EST: 90.6 (estimate)
Happy trading!
Tom


