Market Recap for Friday, July 29, 2016
Friday's end of month action was bifurcated with the Dow Jones lagging and posting a 0.13% decline. The other three major indices did manage to finish in positive territory with sectors finishing in that same bifurcated fashion. Energy (XLE, +1.02%) was the clear leader with exploration & production stocks ($DJUSOS) surging after approaching multi-month price support. Take a look:
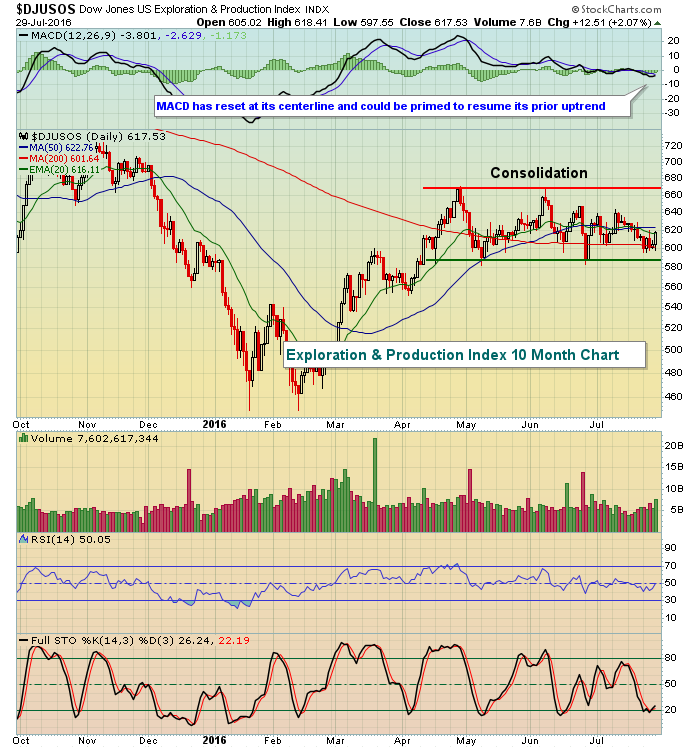 Note also that the volume picked up on Friday's advance. One of my Monday Setups this week comes from this industry group and appears poised for a resumption of its prior uptrend. I'll discuss it later during my Trading Places LIVE webinar.
Materials (XLB, -0.51%) and industrials (XLI, -0.29%) were among the laggards Friday as the market cannot seem to make up its mind whether to continue the breakout or extend its consolidation period with a bit more profit taking.
Pre-Market Action
Crude oil ($WTIC) has begun August just about the same way it traded throughout July - lower. However, August does typically produce rising crude oil prices (see Historical Tendencies section below), the only month to do so in the second half of the calendar year over the past twenty years. Today, crude oil is down 1.4% in early trading.
Action in Asia overnight was mixed while European indices are fractionally lower this morning. Despite that, Dow Jones futures are up slightly once again, even if by only 17 points at last check. For the bears, volatility ($VIX) has been lacking with the VIX tumbling nearly 7% on Friday while S&P 500 prices simply flat-lined. The falling 10 year treasury yield ($TNX) on Friday corresponded with rising treasury prices and that many times is a recipe for falling equity prices. But as has been the case so many times in 2016, that was not to be on Friday as treasury prices and equity prices once again rose in unison.
This morning, the TNX is slightly higher at 1.50%.
Current Outlook
First, let's understand that the MACD (moving average convergence divergence) only takes into consideration price momentum. It ignores the impact of volume. Given that, price action has been extremely bullish and the weekly MACD reflects that, above the centerline and pointing higher on all of our major indices. Below is a quick peek at the S&P 500 and its weekly strength:
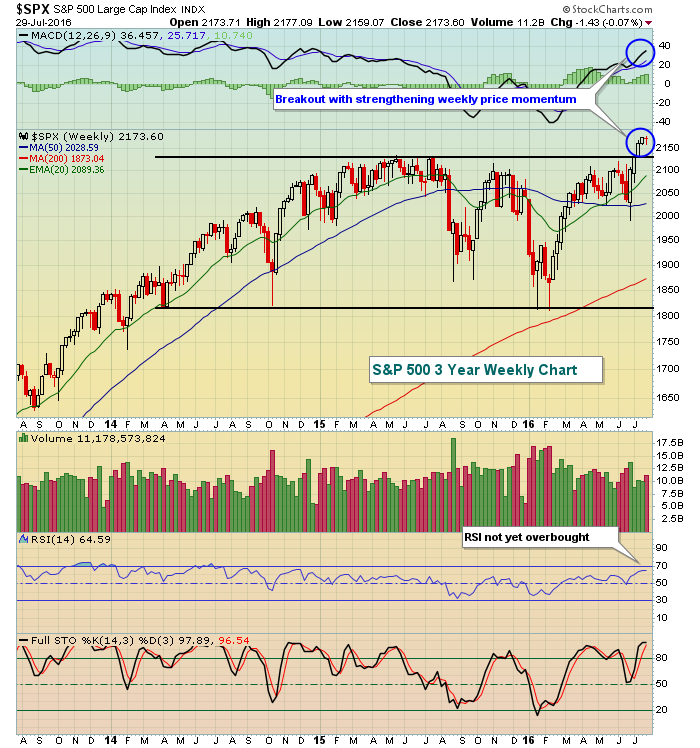 If you're a longer-term buy and hold type and rarely make decisions to exit the stock market, the above chart says everything is great and you should continue to hold. For shorter-term swing traders, price action is undeniably bullish, but a short-term selloff to test rising 20 week EMA support should not be ruled out. In fact, that moving average, currently at 2089, would be most advantageous for entry. Based on years past, August and September will likely provide you that opportunity as they are the weakest back-to-back months in terms of S&P 500 performance since 1950.
Sector/Industry Watch
Consumer staples (XLP) struggled a bit last week, but technically it was simply some profit taking down to initial price support and its 50 day SMA. A break below 54 could represent the possibility of more technical issues ahead, but currently the XLP is a buy. Check it out:
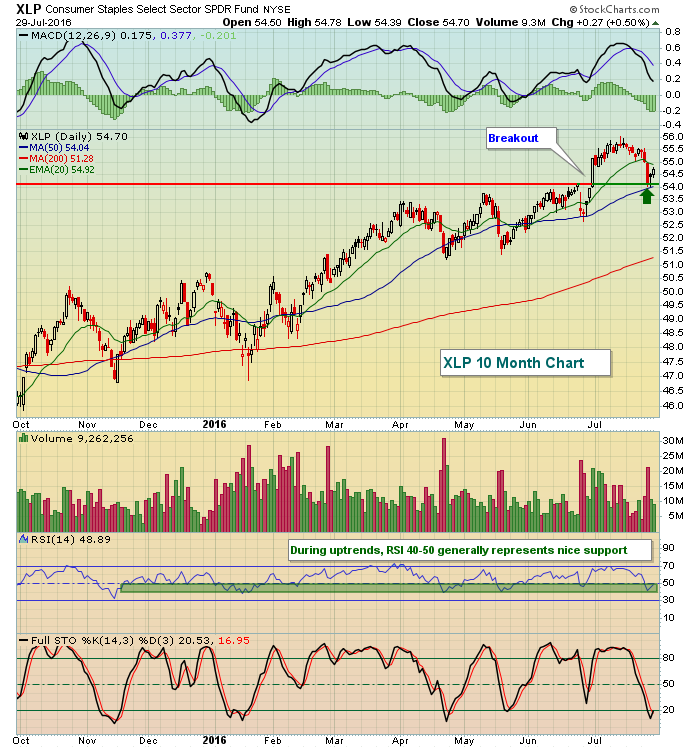 Tuesday and Wednesday of late week created some heartache, but it really just set up a better reward to risk entry possibility. The green shaded area above shows that over the past several months, a trip into the 40s on the RSI has coincided with short-term bottoms.
Monday Setups
Every Monday, I provide a few stock setups for potential trades. Below is one of those stocks for this week, while others are disclosed and discussed during my Trading Places LIVE webinar on Mondays beginning at 1pm EST. You must be a member of StockCharts to attend this webinar. You can REGISTER HERE for today's webinar.
Check out JACK:
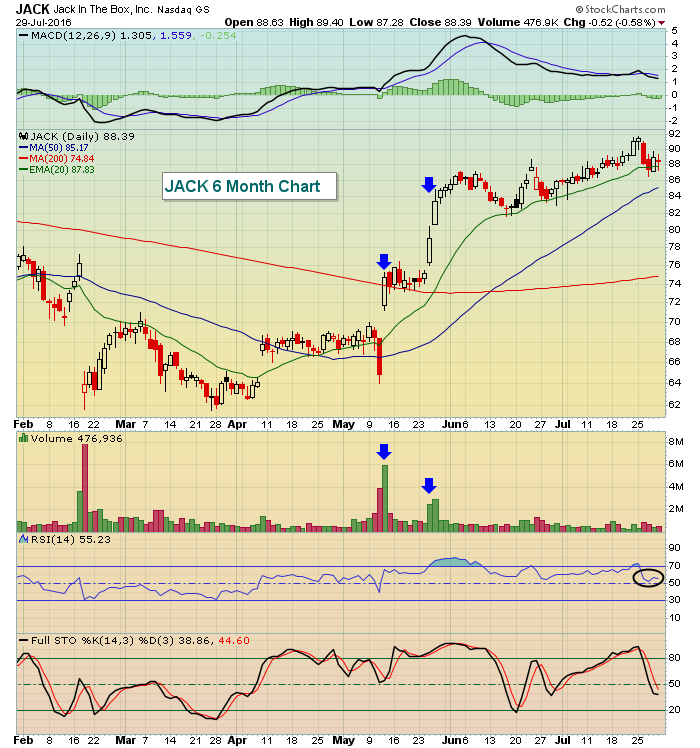 JACK has seen big volume on its most recent moves higher, suggesting accumulation. Normally, entering a stock like this during periods of profit taking to relieve overbought oscillators is a nice reward to risk trade. Over each of the past three days, JACK has successfully tested its rising 20 day EMA and bounced. That 20 day EMA, along with the 50 day SMA, represent the two best reward to risk entries on JACK, in my opinion. Heavy selling below 84, especially 82, would present short-term issues for JACK. Otherwise, look for higher prices.
Historical Tendencies
Crude oil ($WTIC) has been tumbling of late and the second half of the calendar year tends to be a problem for black gold. The silver lining? Over the past twenty years, August has been the only calendar month during the second half of the year that has produced average gains. Take a look at this seasonality chart on crude oil:
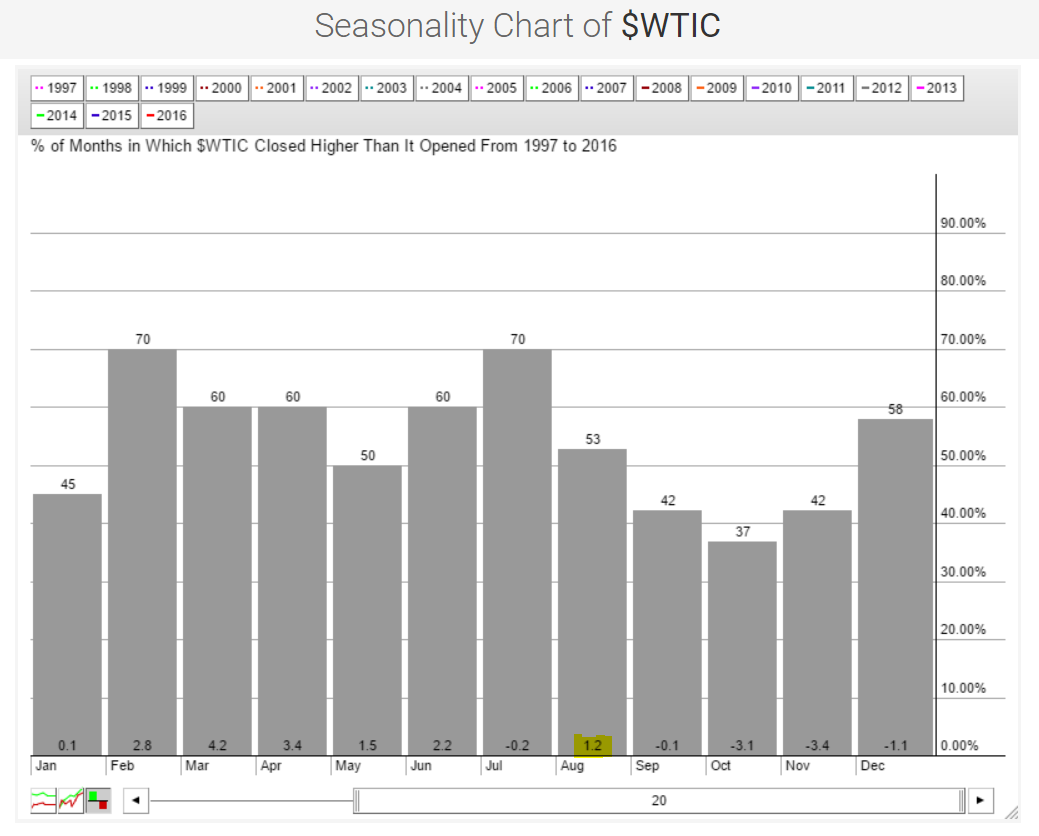 It's interesting that every calendar month during the first half of the year has produced average monthly gains in crude oil over the past twenty years while August is the only month to do so in the second half of the year. Will it hold form in 2016?
Key Earnings Reports
(actual vs. estimate):
L: .60 vs .57
(reports after bell, estimate provided):
DNB: 1.39
TXRH: .44
VMC: .99
VNO: 1.25
WMB: .19
Key Economic Reports
July ISM manufacturing index to be released at 10:00am EST: 53.2 (estimate)
June construction spending to be released at 10:00am EST: +0.6% (estimate)
Happy trading!
Tom


