Market Recap for Wednesday, July 6, 2016
Bulls do not give up easy. Yesterday was a perfect example. Global indices have rolled over and have been struggling mightily this week, especially the key German DAX ($DAX). Brexit fears seemed to be building once again and the S&P 500 quickly was down another 0.75% on top of the 0.75% lost on Tuesday. It certainly appeared that the U.S. market was ready to follow many global indices lower this week. Then the bulls simply said enough is enough and the rally was on the remainder of the day. One positive, however, was that the 60 minute MACD never turned negative and a potential cup is in the process of forming. Take a look:
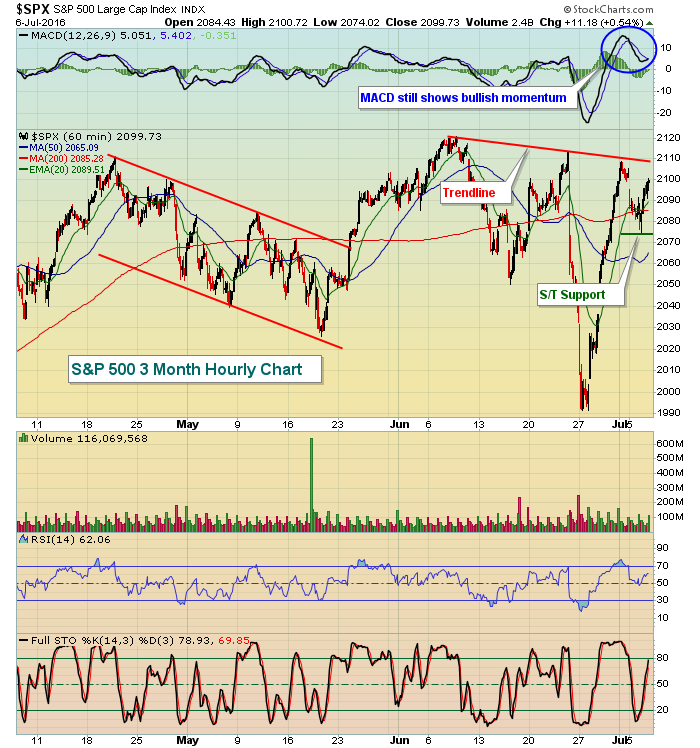 The pullback in July and subsequent recovery is the possible start of a cup with handle pattern - a bullish continuation formation off the recent rally. The bulls will be looking to break the recent downtrend, similar to the break that occurred back in late May. A similar breakout would likely lead to a test of the S&P 500's all-time high close of 2131. Failure, however, and a drop back below 2070 would be short-term bearish and would set up a possible test of the post-Brexit low just below 2000.
In my opinion, the biggest problem for the bulls isn't their resiliency, they have plenty of that. The problem is rotation as market participants continue to move their money into safer areas, perhaps preparing for a market storm ahead. Tops many times form with the stock market turning very cautious and money rotating towards treasuries. That's the exact scenario now. Temporarily, that rotation issue was suspended on Wednesday as consumer discretionary (XLY, +0.86%) and technology (XLK, +0.70%) ranked 2nd and 3rd, respectively, among sectors. Those are aggressive sectors. Healthcare (XLV, +1.12%) led the action, which might seem somewhat defensive. But the aggressive part of healthcare - biotechs ($DJUSBT, +2.37%) were the primary reason for the strength. So at least for a day, money rotated toward offense. That needs to continue.
Pre-Market Action
U.S. futures are near the flat line as traders absorb Wednesday's reversal and search for near-term direction given all the volatility post-Brexit. European indices are higher this morning, but the DAX remains technically challenged and that's the index the S&P 500 most closely correlates to over the long-term.
I would expect action today to be fairly quiet given the important government nonfarm payrolls report that's due out tomorrow morning at 8:30am EST.
Bad news appears to have already been built into the treasury market as the 10 year treasury yield ($TNX) has tumbled to all-time lows. There was a reversing candle on Wednesday, however, and its weekly RSI has dropped to 30, which historically has represented a level where treasuries are sold and the yield rises. Unless the jobs report is abysmal, I'd look for the TNX to move back up to the 1.50%-1.55% area. A push back above 1.55% would likely support a continuing equity rally, but another drop could spook equity traders. Brace yourself.
Current Outlook
While I'm very cautious U.S. stock market action this summer because of rotation to safety, I won't ignore potential bullish signs and patterns. For instance, the NYSE ($NYSE) has printed a long-term bullish inverse head & shoulders pattern, but it has yet to confirm. The pattern itself is bullish if neckline resistance is cleared on accelerating volume. Here's the current look:
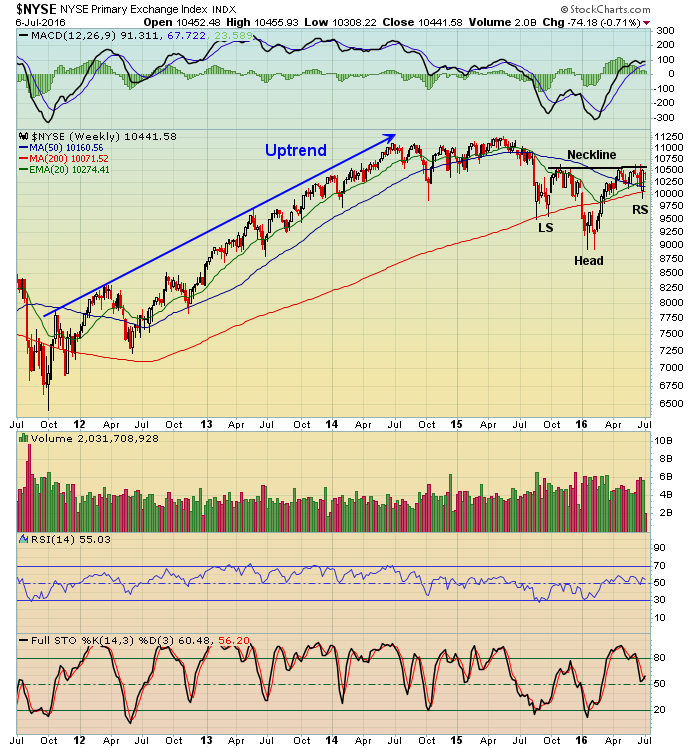 Off the spring highs, the NYSE has printed what appears to be a bullish continuation pattern. That's the good news. There is potential bad news, however. Note where the left shoulder low is - at 9500. A symmetrical inverse head & shoulders pattern would print a right shoulder close to the left shoulder, or potentially 1000 points lower than Wednesday's close. Unfortunately, with overall rotation so bearish the past few months, I believe the possibility of a 10% drop is very real while this pattern would still remain bullish.
Sector/Industry Watch
The Dow Jones U.S. Footwear Index ($DJUSFT) had been a leader throughout much of the current bull market, but it fell upon hard times and has consolidated its gains over the past 9-10 months. Check out the long-term chart:
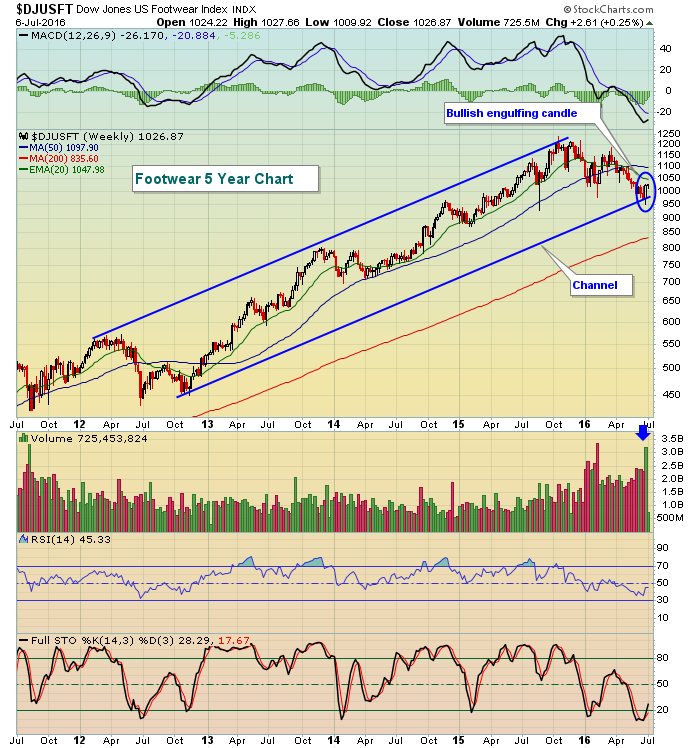 The weakness has been tough if you've been holding long-term, but the overall pattern here still remains bullish in my view. We've held the price low established in the third quarter of 2015 and reversed (bullish engulfing candle) just above that level last week on very heavy volume. Furthermore, the DJUSFT recently printed a positive divergence on its daily chart. Check this out:
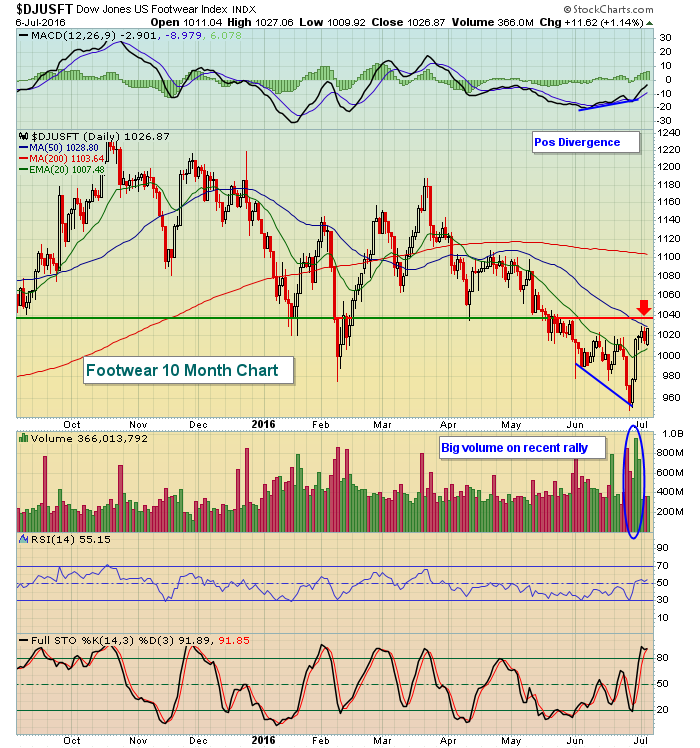 A break above 1040 would likely signal a resumption of the longer-term up channel pointed out on the weekly chart above.
Historical Tendencies
July has produced annualized returns of 2.50% on the NASDAQ since 1971, ranking it as the 10th best month of the calendar year. Only August and September have produced more bearish historical results.
Key Earnings Reports
(actual vs. estimate):
PEP: 1.35 vs 1.28
Key Economic Reports
June ADP employment report released at 8:15am EST: 172,000 (actual) vs. 150,000 (estimate)
Initial jobless claims released at 8:30am EST: 254,000 (actual) vs. 269,000 (estimate)
Happy trading!
Tom


