Market Recap for Thursday, July 7, 2016
Energy (XLE, -1.02%) was weak on Thursday as crude oil prices ($WTIC) tumbled 5.64% to lose near-term price support in the 46.00-46.50 range. Crude oil also lost both 20 day EMA and 50 day SMA support, both of which are short-term bearish as well. The bulls will be looking to the longer-term 20 week EMA, currently at 44.66, for support on any further weakness. Here's the current look at crude oil on a longer-term weekly chart:
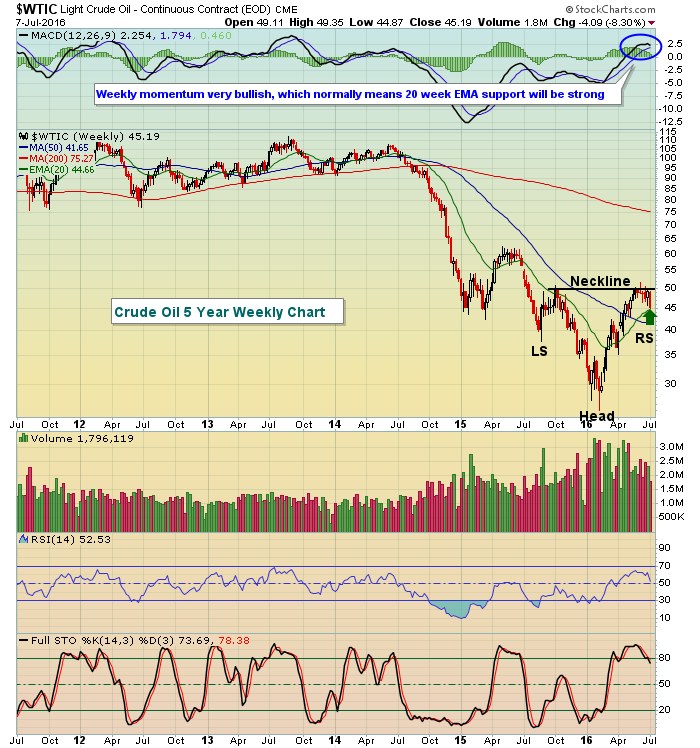 The bottoming reverse head & shoulders pattern remains in play and yesterday's weakness could simply be the final push lower to test rising 20 week EMA support. While a more symmetrical H&S pattern could suggest a steeper decline, weekly momentum of crude oil is quite bullish and 20 period EMAs have a tendency to provide solid support during such periods of strong momentum. We'll see.
Action on Thursday was bifurcated with aggressive areas drawing more attention for a change. The NASDAQ and Russell 2000 but were able to rally and finish in positive territory yesterday, while the Dow Jones and S&P 500 were slightly negative. The defensive utilities (XLU, -1.85%) were the primary culprit as rising treasury yields sent investors scurrying out of that sector. Utilities are reviewed below in the Sector/Industry Watch section.
Pre-Market Action
Overnight, Asian markets were weak with the Tokyo Nikkei ($NIKK) closing less than 1% above its key double bottom near 15000. Bulls will be hoping for another bounce off that 15000 level. In Europe, 1% gains quickly turned into 2% gains on the U.S. jobs report 40 minutes ago on both the German DAX ($DAX) and French CAC 40 ($CAC). They both have a bit more work to do to clear their respective 20 day EMAs, which are declining.
Dow Jones futures have surged 119 points to close in on 18000 while the S&P 500 appears poised to challenge 2110 short-term price resistance at the opening bell. It's much more important, however, to see how we finish today rather than how we open. The bulls will certainly have an opportunity as the last day of the trading week gets underway.
Current Outlook
The strong jobs report and the rising 10 year treasury yield ($TNX) that's likely to accompany it should provide financials (XLF) and, more specifically, banks ($DJUSBK) and life insurance companies ($DJUSIL) a boost as that beaten down area has suffered recently from the tumbling yields. Those falling yields tend to squeeze net margins at banks and also brings into question the strength of the U.S. economy. That, in turn, leads to higher loan reserves, further squeezing bank profits. The TNX is now rising, however, so the DJUSBK should get an opportunity to challenge price resistance in the 290-300 zone. A break above would be bullish for equities, while failure could lead to selling and a potential test of recent S&P 500 lows back below 2000.
The pre-market reaction to the stronger-than-expected nonfarm payrolls report this morning is as you might expect - higher. But can the S&P 500 clear its all-time high close of 2131 with leadership from aggressive areas of the market? That remains the primary obstacle to this seven year bull market and until that leadership emerges, I'd remain quite cautious, despite the initial reaction this morning.
Sector/Industry Watch
Utilities have been very strong in 2016 as plummeting treasury yields have sent income-seeking investors and traders looking for alternatives. Here's the latest technical view of utilities and a visual of how lower treasury yields have impacted the utility sector:
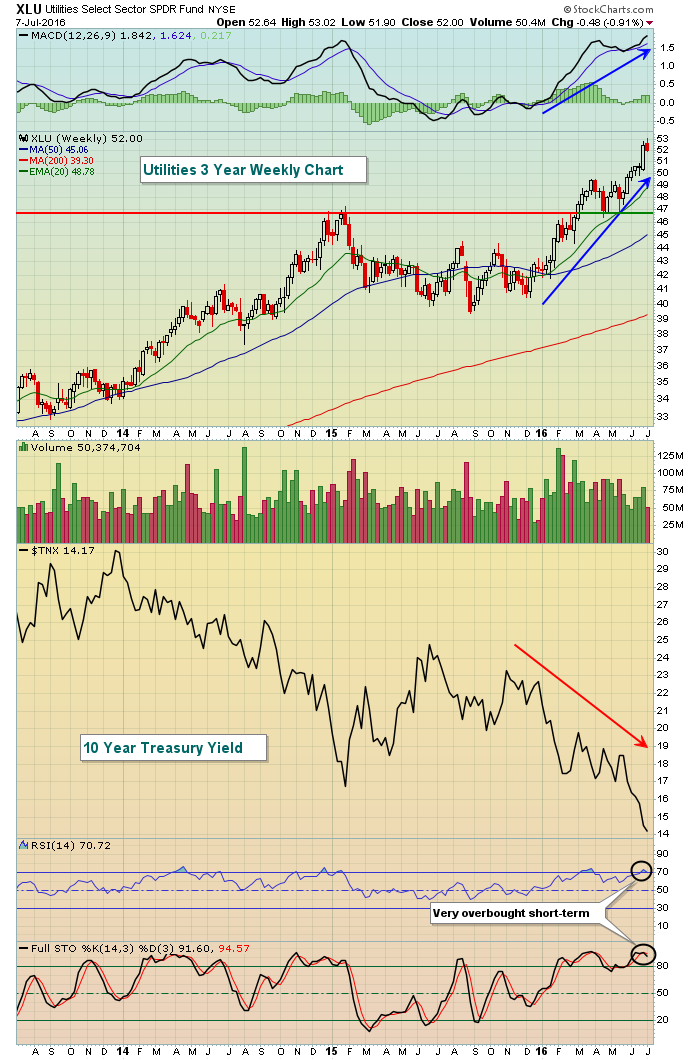 The XLU has become very overbought and is ripe for profit taking, which we saw on Thursday. Given the strength in the jobs market this morning, the profit taking is likely to continue near-term. Major price support now resides just below 47 although a shorter-term test will occur at the rising 20 week EMA, currently at 48.78.
Historical Tendencies
The S&P 500 typically performs quite bullishly through the 6th day of calendar months, but is followed by a period of profit taking from the 7th through the 10th. July tends to buck that historical trend as only the 10th (-35.92%) has produced negative annualized returns since 1950.
Key Earnings Reports
None
Key Economic Reports
June nonfarm payrolls released at 8:30am EST: 287,000 (actual) vs. 180,000 (estimate)
June private payrolls released at 8:30am EST: 265,000 (actual) vs. 170,000 (estimate)
June unemployment rate released at 8:30am EST: 4.9% (actual) vs. 4.8% (estimate)
June average hourly earnings released at 8:30am EST: +0.1% (actual) vs. +0.2% (estimate)
Happy trading!
Tom


