Note:
I will be traveling this weekend and unable to post here in my Trading Places blog on Friday. I hope everyone has a great weekend! Back on Monday!
Market Recap for Wednesday, July 13, 2016
The bullish run that began on June 28th continues despite Wednesday's pause. The rally has been impressive on most fronts, including a bit of rotation toward aggressive sectors. While the defensive utilities (XLU, +0.79%) and consumer staples (XLP, +0.56%) led the action on Wednesday, the shift to risk has been bullish during the last week of this rally as you can see below:
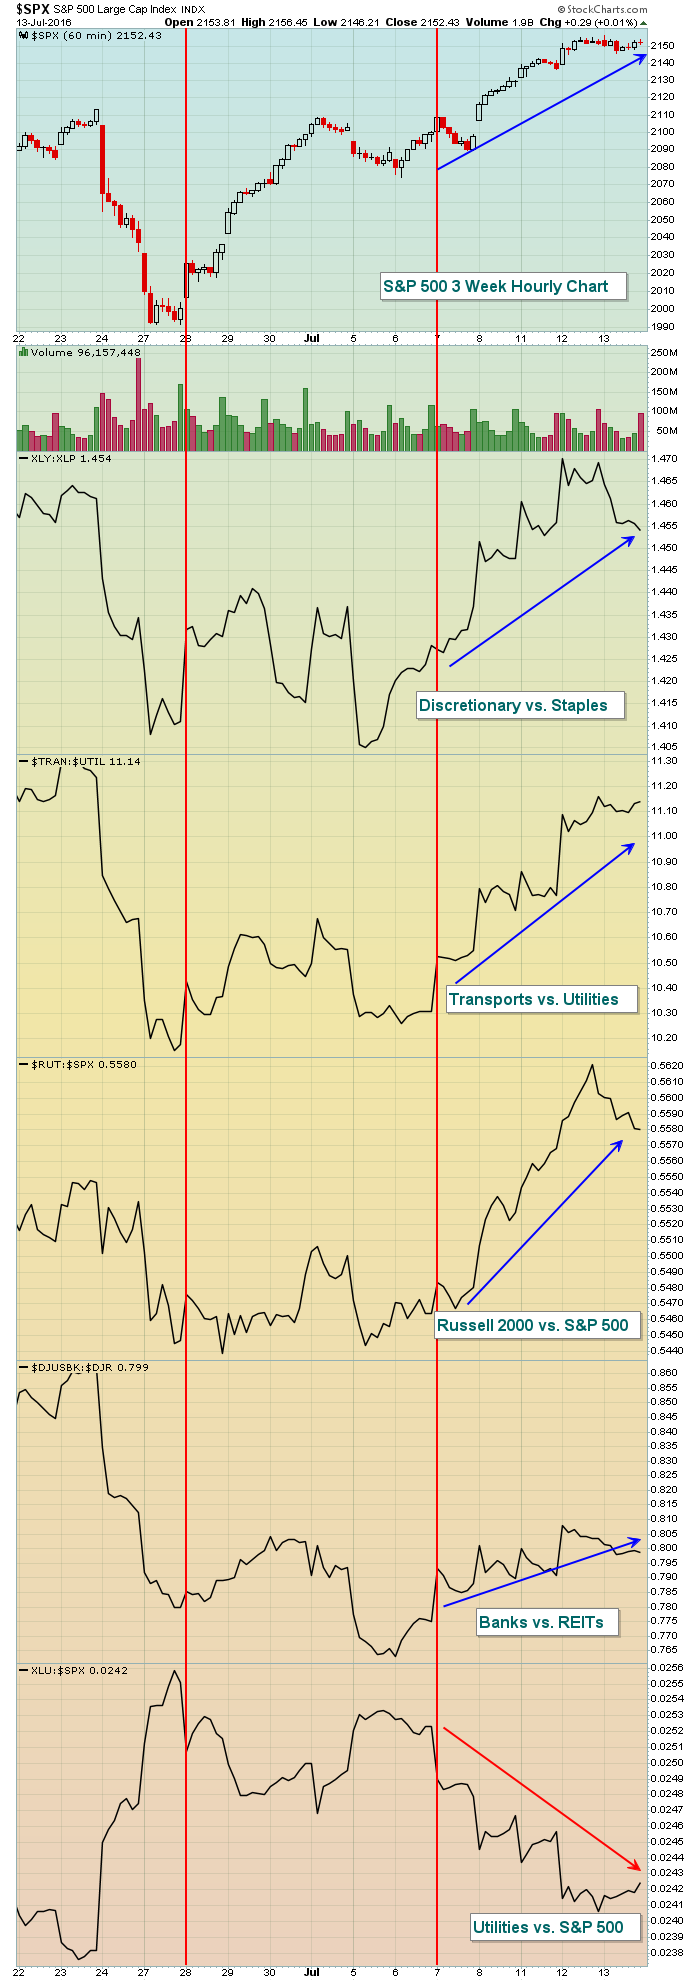 The S&P 500 has gained roughly 160 points since the close on June 27th, but much of this rally saw little rotation towards risk and that's usually a concern of mine. However, the blue line depicts a much different trading environment. Is it too little too late? Well, time will provide our answer, but we should continue to watch the "under the surface" signals to evaluate the sustainability of this push higher. All-time highs are easy to report on, but the truth behind the move is much more important.
CSX reported better than expected EPS and that lifted the entire railroad industry ($DJUSRR). That breakout is reflected below in the Sector/Industry Watch section below.
Pre-Market Action
Banking giant JP Morgan Chase (JPM) reported better than expected earnings this morning and that has helped to reduce the fear that bank earnings would be weak this quarter. Also, the 10 year treasury yield ($TNX) has managed to clear its 20 day EMA resistance at 1.52% in early trading. At last check, the TNX was at 1.54%. A continuing climb in the TNX will help the performance of bank stocks, but will hurt the recent tear that utility bulls have enjoyed.
Current Outlook
U.S. stock futures are higher again this morning, but that may set up a negative divergence on 60 minute charts. Therefore, we should be aware if a confirming reversing candlestick prints on the daily charts. Much of this rally has occurred at the opening bell with gaps higher, not with buying throughout the trading day. That reeks of manipulation as does the lighter than normal volume. For instance, the chart below shows that the NASDAQ has not been able to muster up anything more than average volume during the recent three day advance where the S&P 500 has traded in record all-time high territory. Check it out:
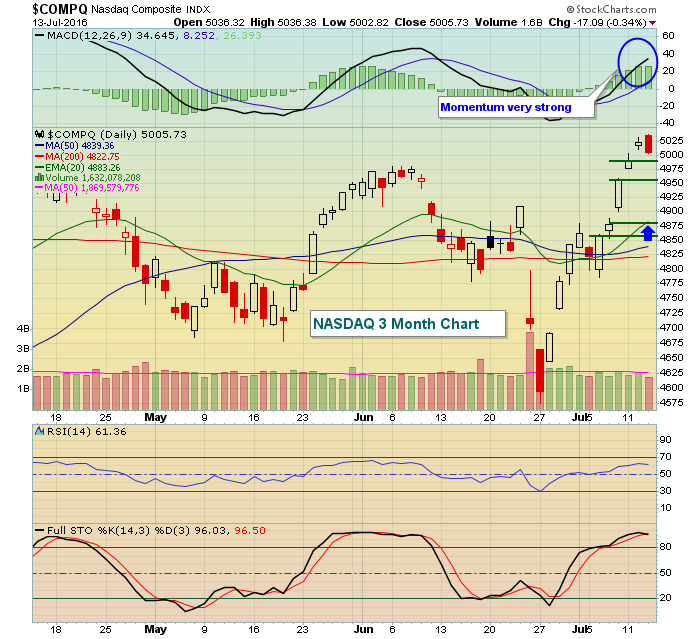 The green horizontal lines show the recent gaps higher that have not been lost. One sign of weakening short-term technical conditions would be the loss of the initial gap support that will be left at yesterday's close once we see this morning's gap higher. Also, many advances end with either an island reversal or an island cluster reversal. Keep an eye out for either of those.
Sector/Industry Watch
Railroads ($DJUSRR) have provided the transports a huge lift during this rally as the DJUSRR has risen more than 15% since the June 27th close. CSX confirmed the rally with a solid beat on its bottom line and the chart below shows the DJUSRR breaking out of a bottoming reverse head & shoulders pattern to multi-month highs:
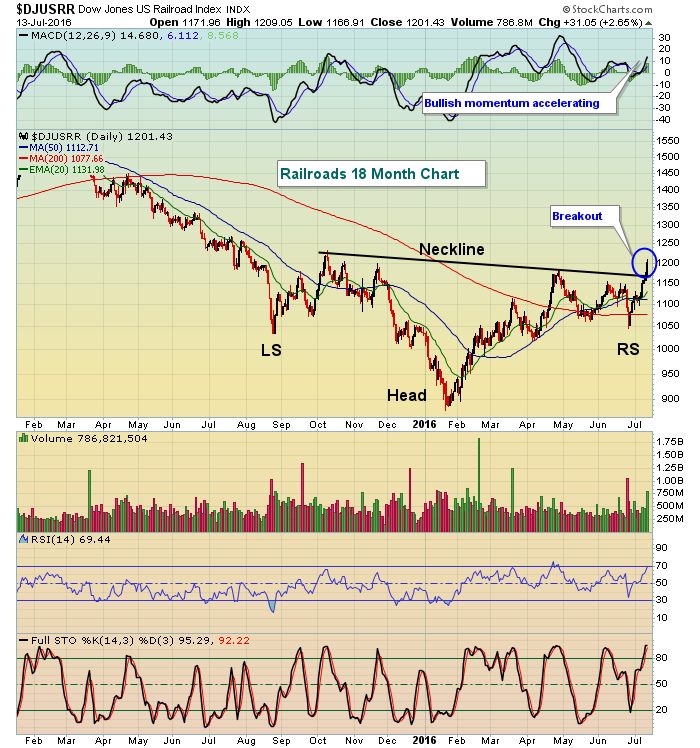 Momentum is accelerating to the upside so I'd expect this breakout to be the beginning of a lengthy trend higher. Failure to hold neckline support and the rising 20 day EMA would mean re-evaluation. Otherwise, this is an industry group to consider on the long side.
Historical Tendencies
The S&P 500 has an average annual return of roughly 9% since 1950. However, the June 28th to July 17th period has produced an annualized return of 22.10%, which is approximately 2 1/2 times the average return seen throughout the year. Unfortunately, this bullish period ends at the close tomorrow and we embark on the worst period (July 18th to September 27th) of the year on the S&P 500.
Key Earnings Reports
(actual vs. estimate):
BLK: 4.78 vs 4.79
DAL: 1.47 vs 1.48
JPM: 1.55 vs 1.43
Key Economic Reports
Initial jobless claims released at 8:30am EST: 254,000 (actual) vs. 265,000 (estimate)
June PPI released at 8:30am EST: +0.5% (actual) vs. +0.3% (estimate)
June Core PPI released at 8:30am EST: +0.4% (actual) vs. +0.2% (estimate)
Happy trading!
Tom


