Market Recap for Tuesday, July 12, 2016
Energy (XLE, +2.48%) resumed its leadership role in a big way on Tuesday as rising crude oil prices ($WTIC) and a bullish pattern on the U.S. dollar provided energy bulls all they needed to send the XLE to its highest close since November 2015. Here's a look at the chart:
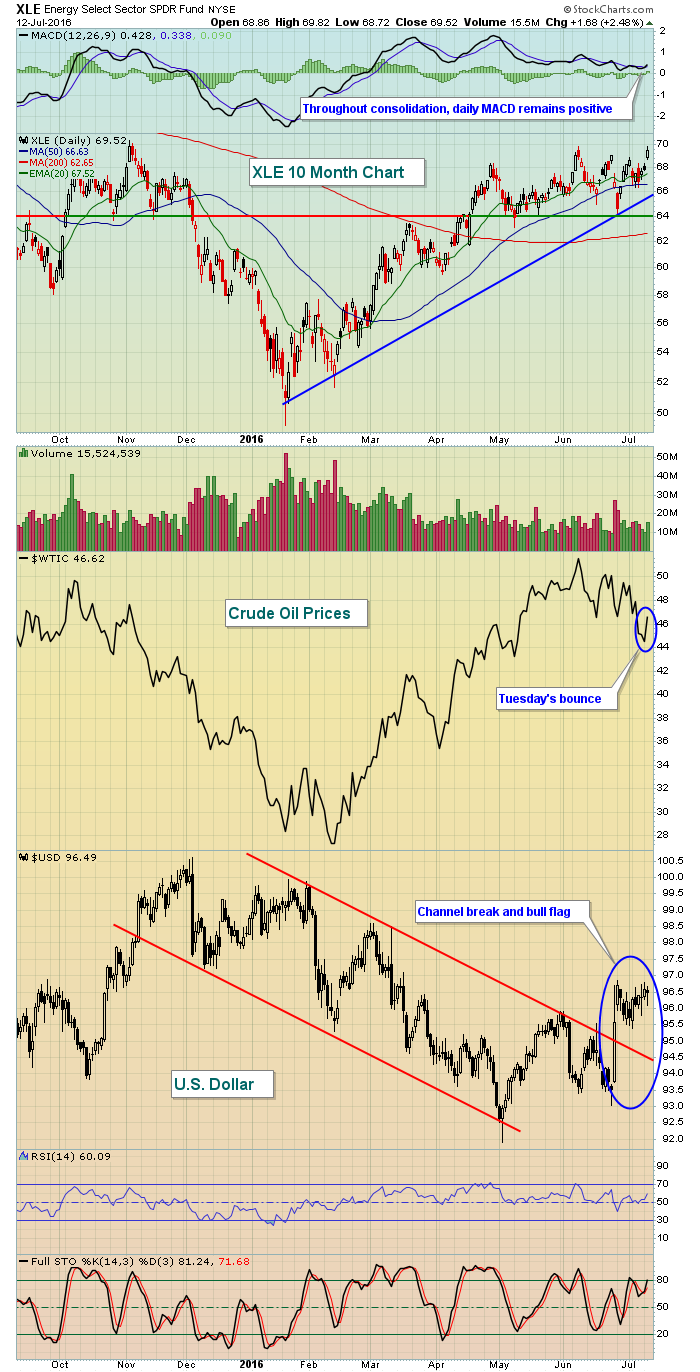 The dollar's recent break of its downtrend channel has opened the door to further relative strength in both energy and materials (XLB, +1.82%) and the bulls are taking advantage. The XLB is on the brink of a breakout to join the XLE.
Seven of the nine sectors participated in Tuesday's rally with only utilities (XLU, -1.37%) and consumer staples (XLP, -0.54%) failing to finish in positive territory. The recent weakness in the XLU is understandable given the surge in the 10 year treasury yield ($TNX) to 1.51%. However, the TNX has hit 20 day EMA resistance at that level and is turning lower thus far in early morning trading. Failure of the TNX at the 20 day EMA could encourage traders to begin to move back into the XLU.
Pre-Market Action
Most global markets were green overnight and that has U.S. futures once again in positive territory as the bulls look to extend the recent advance into all-time record high territory. The Dow Jones futures are up 35 points at last check. The gains aren't huge, but they rarely are during bull market advances. Instead, action tends to turn dull as our major indices seem to climb day after day with little selling.
Earnings season will begin to pick up into next week. Tonight, we'll hear from a key railroad (CSX) and a restaurant (YUM).
Current Outlook
Now that the S&P 500 is in all-time closing high territory, the obvious question is how far might this advance stretch? Well, it's difficult to say, but I'd look for some profit taking fairly soon to carry this benchmark index back to at least test its 2131 breakout level at a minimum. Beyond that the rising 20 day EMA, currently at 2097, would be a likely short-term target. Calling the top is difficult, but overbought conditions on 60 minute charts can many times be an early signal. Therefore, let's look at the current 60 minute technical view:
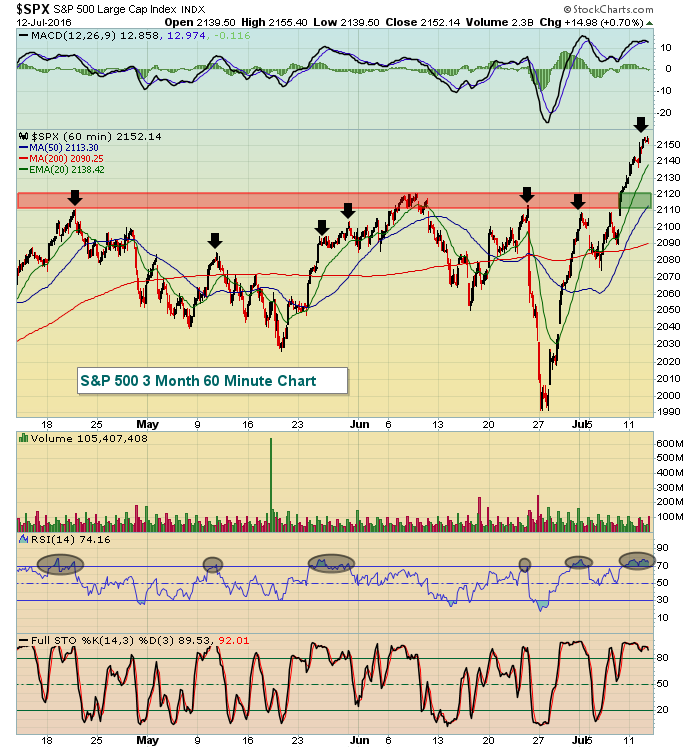 The black shaded areas show that the RSI has been at or above the overbought 70 level on several occasions over the past three months. Additionally, though not highlighted above, stochastic has also been above 90 simultaneously. That combination - RSI over 70 and stochastic above 90 - generally results in a period of profit taking. It's important to keep in mind that such overbought conditions do not necessarily mark long-term tops.
The corresponding black arrows show that, for the most part, overbought conditions have resulted in short-term bouts of profit taking. The S&P 500 is now overbought for sure and is likely in need of at least some short-term selling to unwind these intraday momentum oscillators. Overbought can remain overbought for lengthy stretches, however, so these overbought conditions do not guarantee a near-term top. They simply suggest it's growing riskier to hold onto short-term long trading positions.
Sector/Industry Watch
The Dow Jones U.S. Food Products Index ($DJUSFP) has been a tremendous performer off the February lows. This industry group has been a leader among its consumer staples peers, as well as versus the benchmark S&P 500 index. Therefore, while relative strength continues, pullbacks should be viewed as opportunities for entry. We could be in the midst of a short-term pullback to the rising 20 day EMA and price support as reflected below:
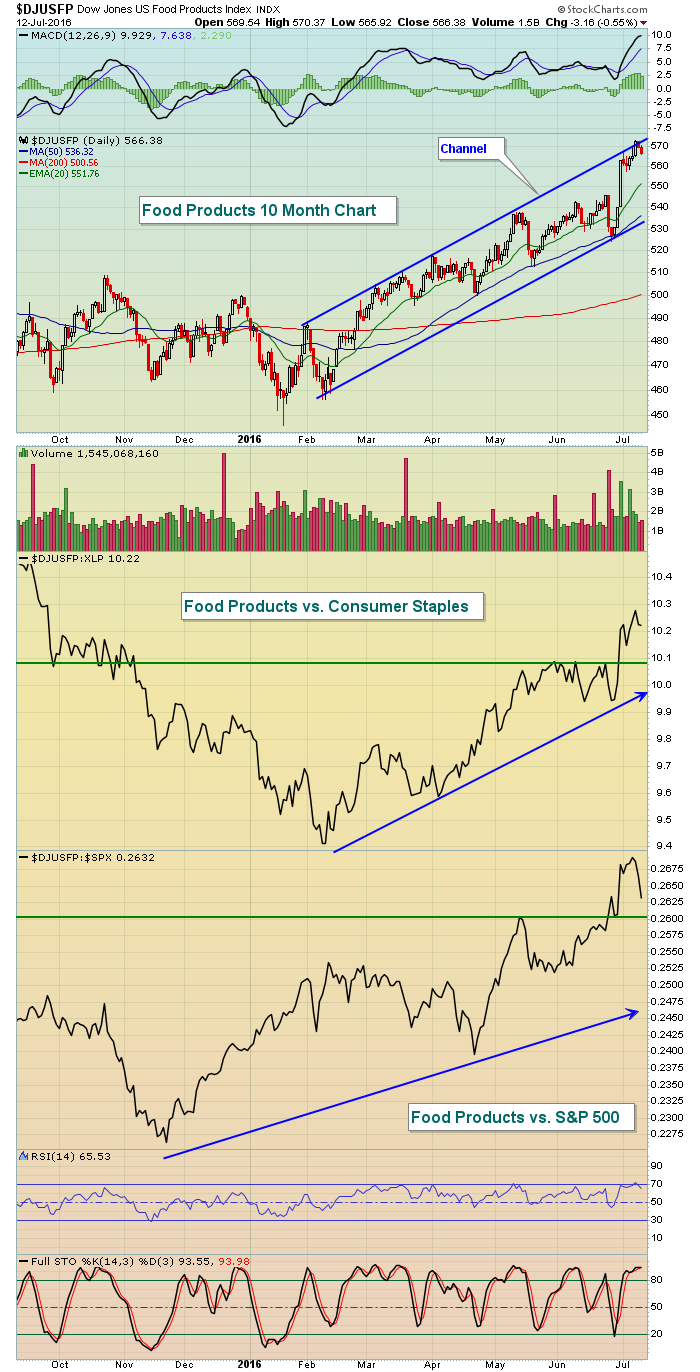 As you can see from the above, price action has remained in a very bullish up channel for months while relative strength is apparent vs. both DJUSFP's peers and vs. the S&P 500. The green horizontal lines suggest possible relative turning points. On an absolute basis, the rising 20 day EMA is at 552 while price support resides close to 546. I'd look for a turn higher in this support zone.
Historical Tendencies
In the past two days, I've featured annualized returns for this calendar week on both the S&P 500 and NASDAQ. The Russell 2000 is also bullish this week, but the consistency is not as strong as I posted yesterday on the NASDAQ. However, July 13th (today) is the strongest day of July for small caps historically as the Russell 2000 has posted annualized returns of 122.32% on this day since 1987.
Key Earnings Reports
(reports after close, estimate provided):
CSX: .44
YUM: .74
Key Economic Reports
Beige Book to be released at 2:00pm EST
Happy trading!
Tom


