Market Recap for Friday, August 12, 2016
It was another day of indecision - but within the confines of a continuing uptrend. The NASDAQ and Russell 2000 eked out gains while both the Dow Jones and S&P 500 suffered fractional losses. Negative divergences are now present on the daily charts of each of our major indices and this indication of slowing momentum is also accompanied by extremely light volume. The NASDAQ has seen less than 1.5 billion shares change hands on two consecutive days for the first time since the middle of August 2015 when we saw three such consecutive days - and just prior to the flash crash.
Volatility ($VIX) remains at a very low level, closing on Friday at 11.55. This suggests that the market is looking for very little volatility in the days and weeks ahead and that bodes well for the bulls. Still, seeing volume disappear on the latest price rise also tells us that there isn't much accumulation taking place.
Energy (XLE, +0.56%) was the leader on Friday and isn't far from its next breakout. Here's the latest on the chart:
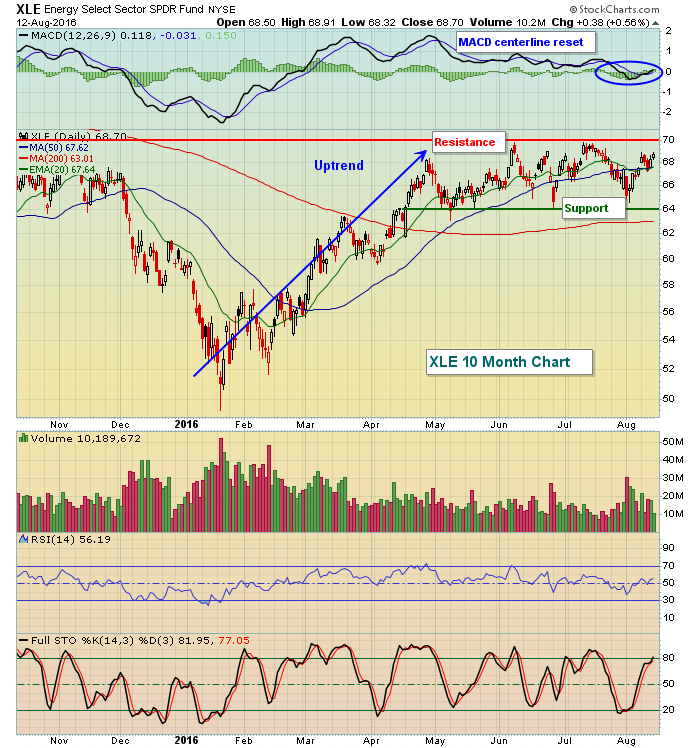 The resistance and support call out boxes highlight the key areas within this continuation pattern. A break below 64 would be bearish, while a breakout above 70.50 would likely lead to more outperformance by energy shares.
Materials (XLB, -1.06%) were the weakest link on Friday as the dollar strengthened after a weak opening. Materials tend to move opposite the dollar as is reflected below in the Sector/Industry Watch section below.
Pre-Market Action
While it's not reflected on the chart below, China's Shanghai Composite ($SSEC) rose overnight to close at 3125, its first close over 3100 since the first few days of 2016. Take a look:
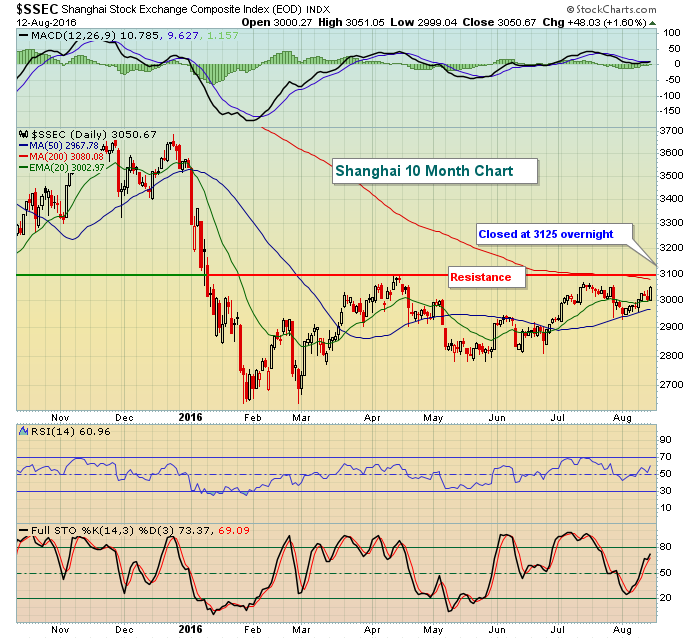 Other action in Asia was mixed with the Hang Seng ($HSI) rising while the Nikkei ($NIKK) fell. In Europe, we're seeing fractional gains this morning.
Currently, the Dow Jones futures are higher by 47 points as the U.S. market looks to start another week on a positive note.
Current Outlook
The slight negative divergences have now crept onto the daily charts of all of our major indices, suggesting that gains in Europe (especially the German DAX) might be easier than gains in the U.S. - at least in the near-term. The first sign of extended weakness on the S&P 500 would be the loss of trendline and short-term price support. Those two levels can be seen easily on this chart:
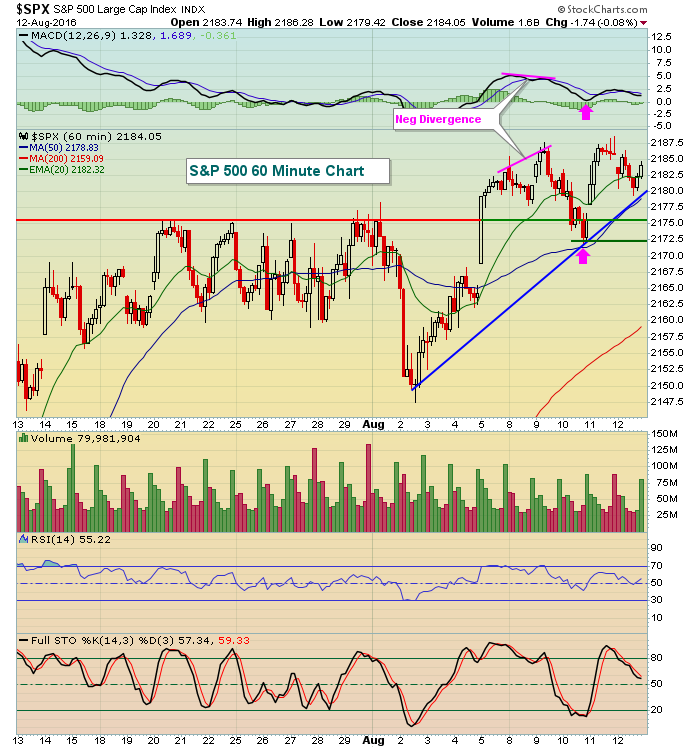 While the overall trend has continued to push higher, note how the 60 minute negative divergence slowed progress for a brief period. The two pink arrows highlight the MACD centerline reset and the 50 period SMA test that I look for after a negative divergence emerges. That's why we should be a bit cautious with negative divergences now appearing on the daily charts. Daily negative divergences typically take longer to play out and usually result either in quick selling OR sideways consolidation to allow the rising 50 day SMA to move higher to meet current price.
Sector/Industry Watch
Materials (XLB) have been performing exceptionally well vs. the S&P 500 throughout much of 2016, but the group has been struggling as the dollar (UUP) has resumed its prior upward trend. While the dollar certainly isn't the only factor in the direction of materials stocks, it's a significant one as reflected below:
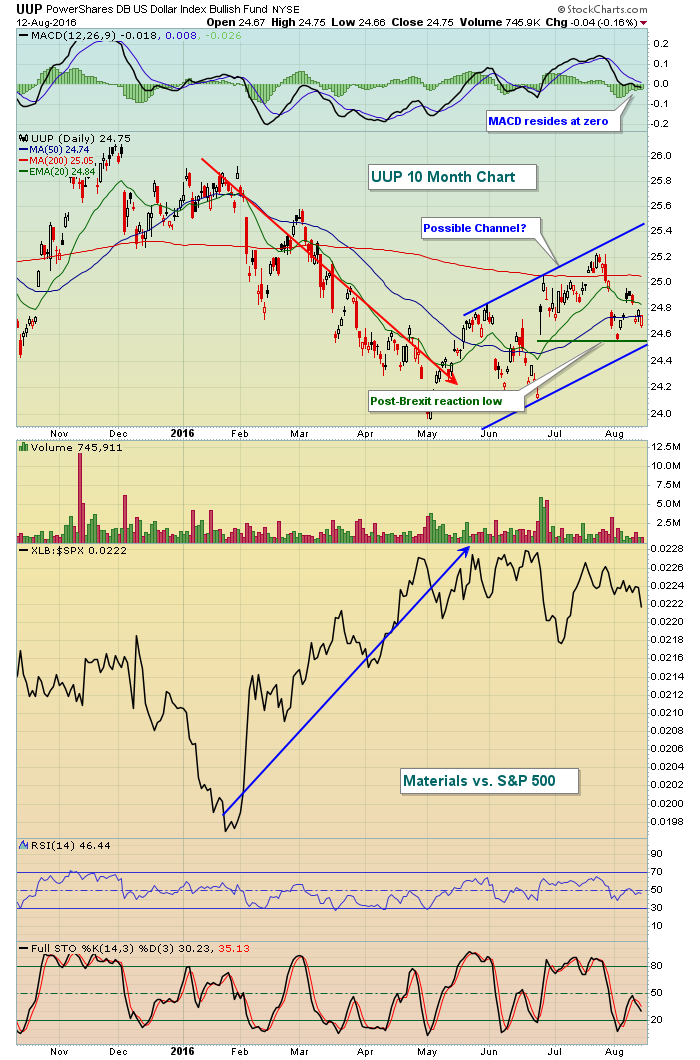 This reflects only the last 10 months and does not show the parabolic rise in the dollar that took place from mid-2014 to early-2015. Since that time, the dollar has been consolidating. The dollar could be in the midst of an up channel as the XLB has begun to weaken vs. the S&P 500 (XLB:$SPX) since topping on a relative basis in late June.
Monday Setup
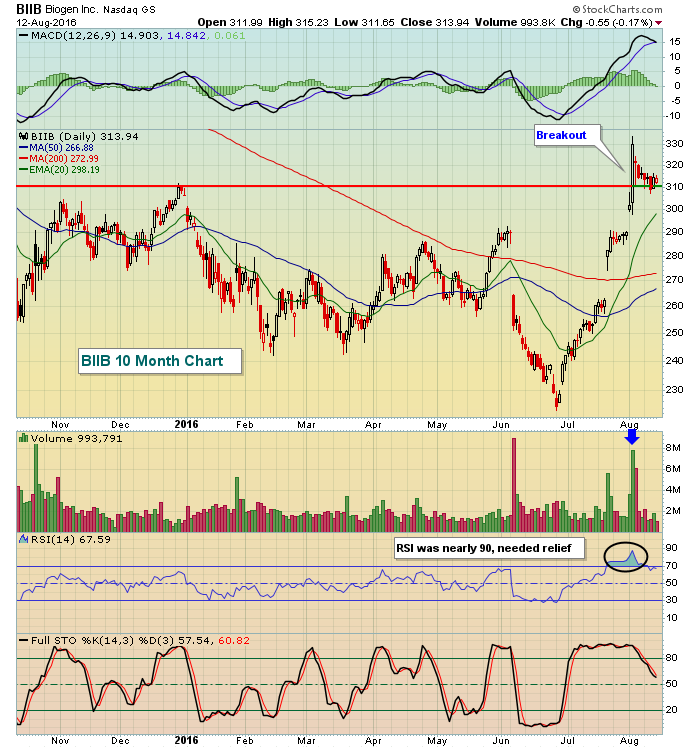
Biogen (BIIB) exploded higher on heavy volume nearly two weeks ago to clear resistance near 310. The lighter volume selling has helped to relieve the overbought conditions as you can see below:
 I will be discussing this setup in more detail, along with 2-3 other setups, during my Trading Places LIVE webinar scheduled for 1pm EST. You can register by CLICKING HERE.
Historical Tendencies
The middle of the month, like the beginning of the month, tends to see money inflows, helping to lift major U.S. markets. While the 15th calendar day of the month shows tepid bullish behavior, the 16th is flat out bullish with annualized returns of 34% and 39% on the S&P 500 and NASDAQ, respectively.
Key Earnings Reports
(actual vs. estimate):
SYY: .64 vs .60
(reports after close, estimate provided):
VIPS: .14
Key Economic Reports
August empire state manufacturing survey released at 8:30am EST: -4.21 (actual) vs. +2.50 (estimate)
August housing market index to be released at 10:00am EST: 60 (estimate)
Happy trading!
Tom


