Market Recap for Thursday, August 11, 2016
Crude oil surged more than 6% yesterday and energy (XLE, +1.47%) led yet another S&P 500 rally with that benchmark index finishing at a record high. Initial price support at 2175 held before the bulls were back on the attack. Volume remained well below average and the breakout does come with a negative divergence still in play on the daily chart. Take a look:
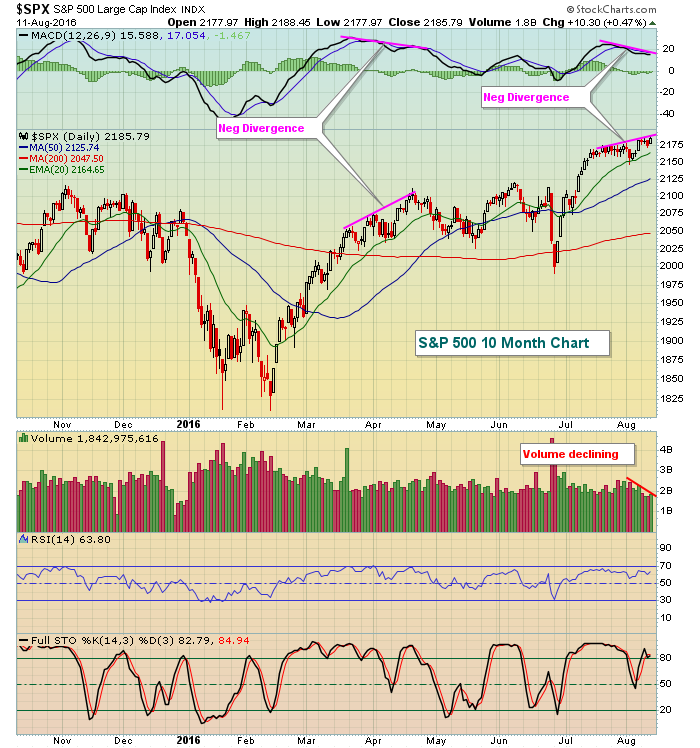 The good news is that we don't know how far this rally might go. We need to evaluate the MACD when the top is in. How do you know if a top is in? Well, you don't. But if a higher volume reversing candle were to print, it'd be another technical signal that a top was in. The bad news is that you can look back to April to see what happened the last time the S&P 500 printed a negative divergence on its daily chart.
Consumer discretionary (XLY, +1.00%) also performed extremely well and battered the consumer staples group (XLP, 0.00%) on a relative basis. As you probably know, I find the XLY:XLP ratio to be very helpful in evaluating the sustainability of any S&P 500 rally. That ratio is still trending higher although it's struggled to close above 1.50 over the past few months. Yesterday it closed at 1.494.
Pre-Market Action
July retail sales missed badly, but thus far the negative reaction in futures has been muted. Dow Jones futures currently stand at -16, which isn't bad considering the recent gains and the poor retail sales numbers. The 10 year treasury yield ($TNX), however, has been quite negative, dropping 8 basis points to the 1.50% level. In other words, money is flocking this morning towards safety. We'll see if that later transpires into selling of U.S. equities.
The German DAX did drop immediately after the retail sales numbers hit, but it has since recovered those losses. Still, European indices are in the red after Asian markets rallied overnight.
Current Outlook
The NASDAQ has closed at all-time highs two of the past three sessions, but volume has been absolutely anemic. Check out the volume vs. average volume the past 60 days:
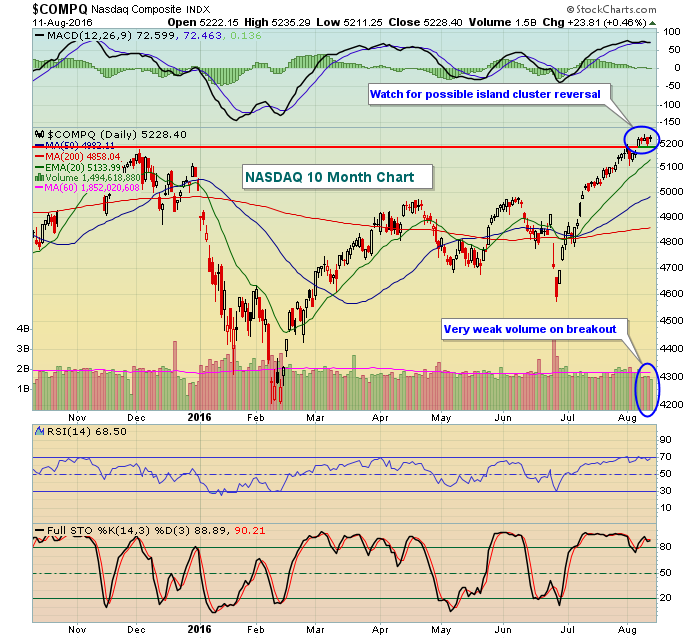 It's nice to see the bullish price action and the breakout, but doing it during the summer months and on volume of 1.5 billion shares is a bit disturbing technically. We gapped up with jobs numbers last week so keep an eye out for a news event that could trigger a gap down to leave the recent candles on an "island". That's a reversing pattern and could mark a short-term top, especially considering that the NASDAQ has been overbought most of the past two weeks.
Sector/Industry Watch
The Dow Jones U.S. Footwear Index ($DJUSFT) remains in a weekly bullish wedge pattern that spans ten months. A breakout of this bullish pattern would be a huge buy signal on the group as a whole, but particularly Nike (NKE) where we've seen incredible historical strength beginning in September of each year. You can check out NKE's seasonal trends in the Historical Tendencies section below, but for now take a look at the pattern on the DJUSFT:
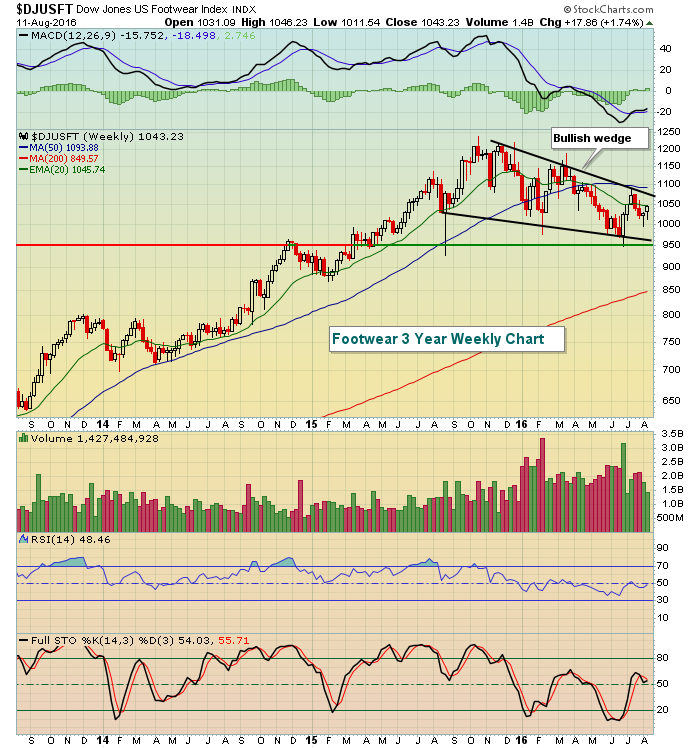 High volume should accompany a breakout of this pattern as well.
Historical Tendencies
Nike (NKE) has typically performed very well during the final four months of the calendar year. Check out the historical results of NKE over the past twenty years:
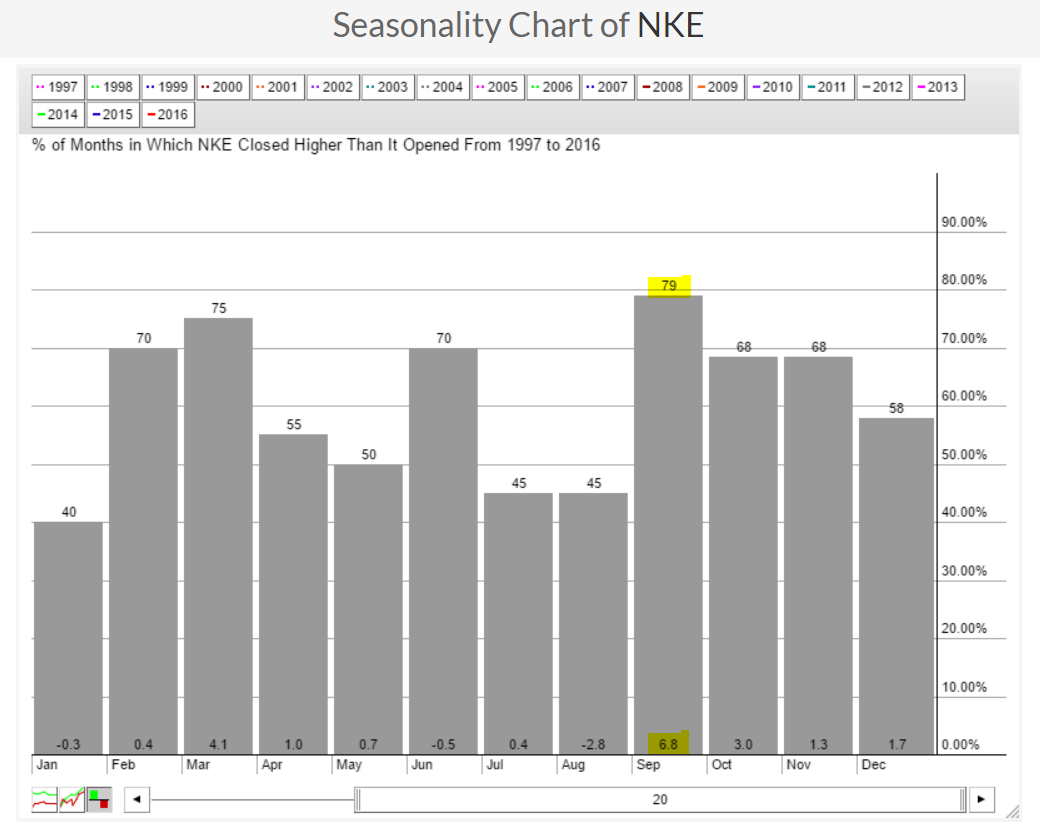 Considering that September has been the worst calendar for S&P 500 performance since 1950, the NKE seasonality is a bit startling, but the September outperformance could relate to "back to school".
Key Earnings Reports
(actual vs. estimate):
JCP: (.05) vs (.15)
Key Economic Reports
July PPI released at 8:30am EST: -0.4% (actual) vs. +0.1% (estimate)
July Core PPI released at 8:30am EST: -0.3% (actual) vs. +0.2% (estimate)
July retail sales released at 8:30am EST: +0.0% (actual) vs. +0.4% (estimate)
July retail sales ex-auto released at 8:30am EST: -0.3% (actual) vs. +0.2% (estimate)
June business inventories to be released at 10:00am EST: +0.1% (estimate)
August consumer sentiment to be released at 10:00am EST: 91.0 (estimate)
Happy trading!
Tom


