Market Recap for Tuesday, August 9, 2016
It was another day of watching paint dry as the Dow Jones, S&P 500, NASDAQ and Russell 2000 gained 0.02%, 0.10%, 0.24% and 0.11%, respectively. The Dow Jones traded in a 70 point range and a final 25 point surge (ok surge might not be the appropriate term) over the last 90 minutes sent the Dow into positive territory - barely. But a gain is a gain I suppose.
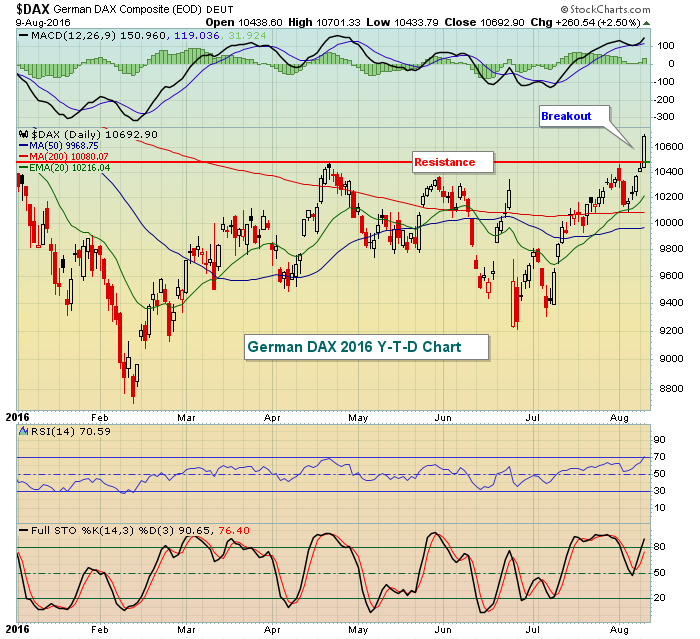
The complete disregard here in the U.S. of a major breakout in the German DAX ($DAX) was perhaps the most surprising development yesterday. The DAX exploded through 10500, finishing higher by 260 points, or 2.50%, on the session. After months of failing at that key level, I would've expected more of a robust response on the S&P 500. Check out the bullish assault in Germany:
 But while action in Europe clearly took on a much more bullish tone, everything remained subdued here. Consumer staples (XLP, +0.31%) led the action from a sector perspective, followed by another defensive group, healthcare (XLV, +0.24%). Trading on very light volume and being led by defense wasn't exactly what I was looking for, but we'll see if more bullish action resumes today.
Pre-Market Action
Once again, today is void of key economic reports and provides little in the way of major earnings news. Yesterday, despite that, the U.S. stock market seemed to care little about the technical breakout in Germany. We'll see if it has any more impact in today's trading.
Overnight, Asian markets were mixed and hovered near the flat line. In Europe, the key indices are slightly red this morning. However, considering the sizable gains in Germany, a little profit taking shouldn't be viewed bearishly. I would grow a bit more concerned if the DAX were to lose support on a closing basis near 10450. Until that happens, it's full speed ahead there.
If you're viewing the market with a glass half empty approach, it should be noted that the 10 year treasury yield ($TNX) failed at 1.60% resistance and is lower this morning to 1.52%, down a couple basis points. So money also has been rotating back towards the defensive treasury market, a potentially bearish development for U.S. equities, particularly financials (XLF) as they made a bullish move while the TNX was in rally mode.
Current Outlook
A 60 minute negative divergence emerged on Tuesday across all of our major indices except the Russell 2000. The hourly MACD there turned down, but a negative divergence did not print because small caps did not see a new price high. A negative divergence occurs when new price highs are no longer accompanied with higher MACDs. Below is the 60 minute negative divergence on the S&P 500:
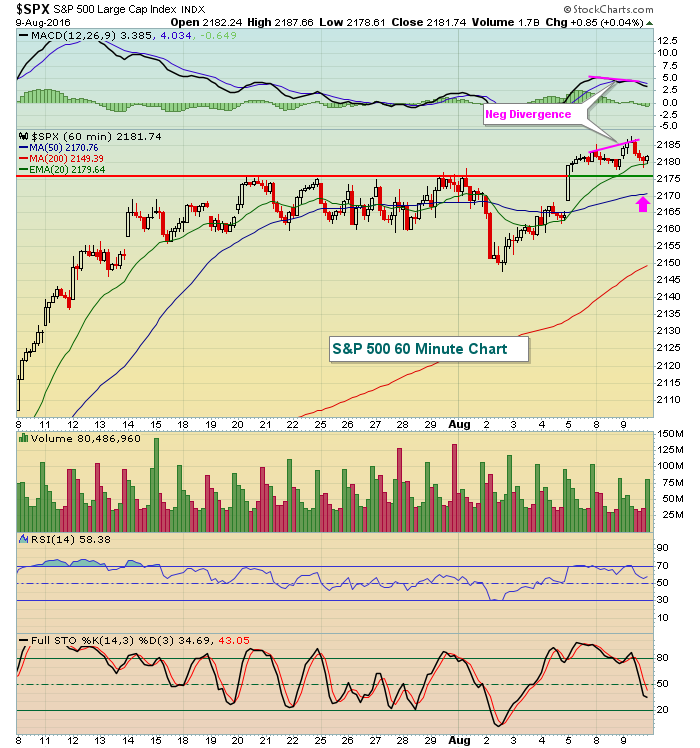 Short-term price support is reflected above near the 2175 level, but I'd look for a 50 hour SMA test (pink arrow) just above 2170. Further slowing of momentum was evident in the volume yesterday on the S&P 500 - just 1.7 billion shares vs. the average volume over the past 60 days of 2.2 billion shares.
Sector/Industry Watch
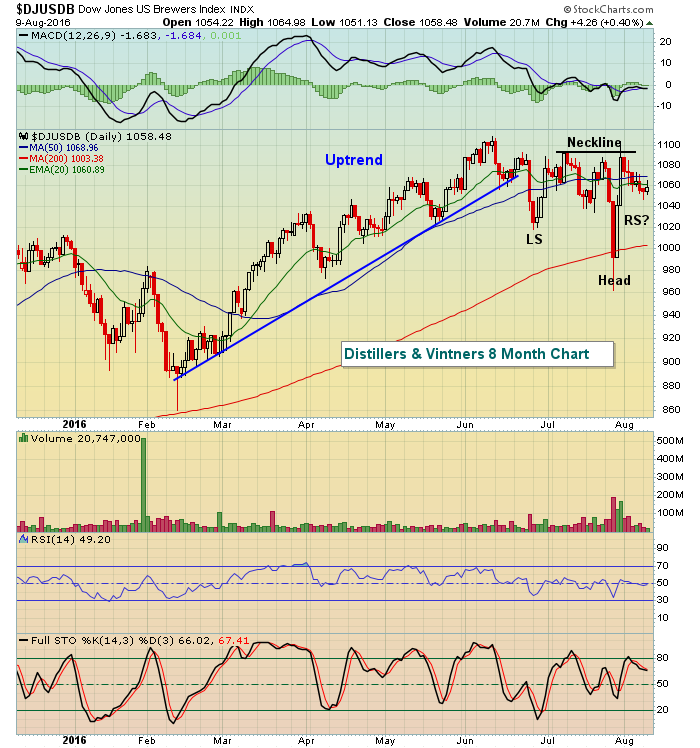
The Dow Jones U.S. Distillers & Vintners Index ($DJUSDB) appears to be in the process of printing a bullish inverse head & shoulders pattern. Recent weakness comes after the DJUSDB tested neckline support. Here's the current look:
Historical Tendencies
Since 1950 on the S&P 500, the 7th calendar day of the month through the 10th calendar day of the month typically has been a period of profit taking. Here are the annualized returns for each of these four calendar days (for all months, not just August):
7th: -12.45%
8th: +1.44%
9th: -19.74%
10th: +4.53%
The S&P 500 has averaged gaining roughly 9% per year since 1950. You can see from the above that the 7th through 10th period typically underperforms by a very wide margin. If every day were created equal in the stock market, we should see 9% returns across the board. Instead, this is a period where the slowing of money flow and manipulation by big investment firms weighs heavily on market performance. As a short-term trader, you should always be aware of the potential of profit taking and short-term declines as a result.
Key Earnings Reports
(actual vs. estimate):
KORS: .88 vs .74
PRGO: 1.93 vs 2.00
RL: 1.06 vs .89
Key Economic Reports
None
Happy trading!
Tom


